Affective Trajectories
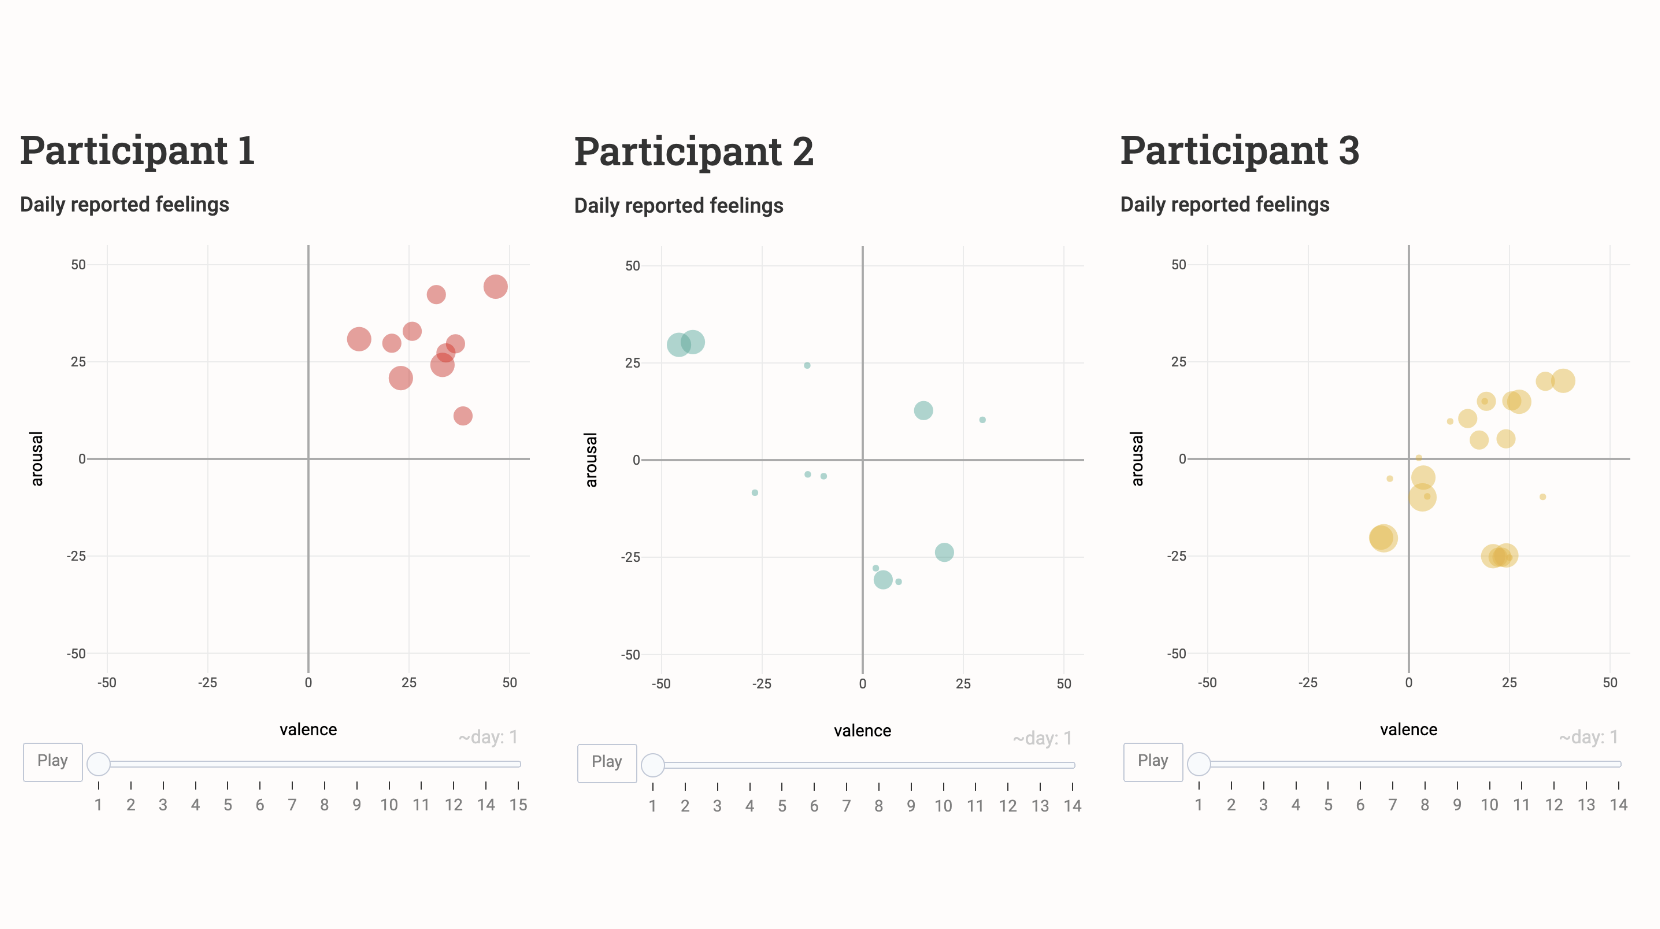
How do our feelings shift over time? Do we tread a similar affective path each day or chart a new one? This project illustrates the emotional journeys of six people over a two-week period. The design includes animation and small multiples to show how feelings can shift rapidly and intensely for some and stay stagnant for others.
🧰 Built with: R, HTML/CSS
🗄️ Data source: Interdisciplinary Affective Science Lab
🔗 View on Github Pages
Psychologist Testimony
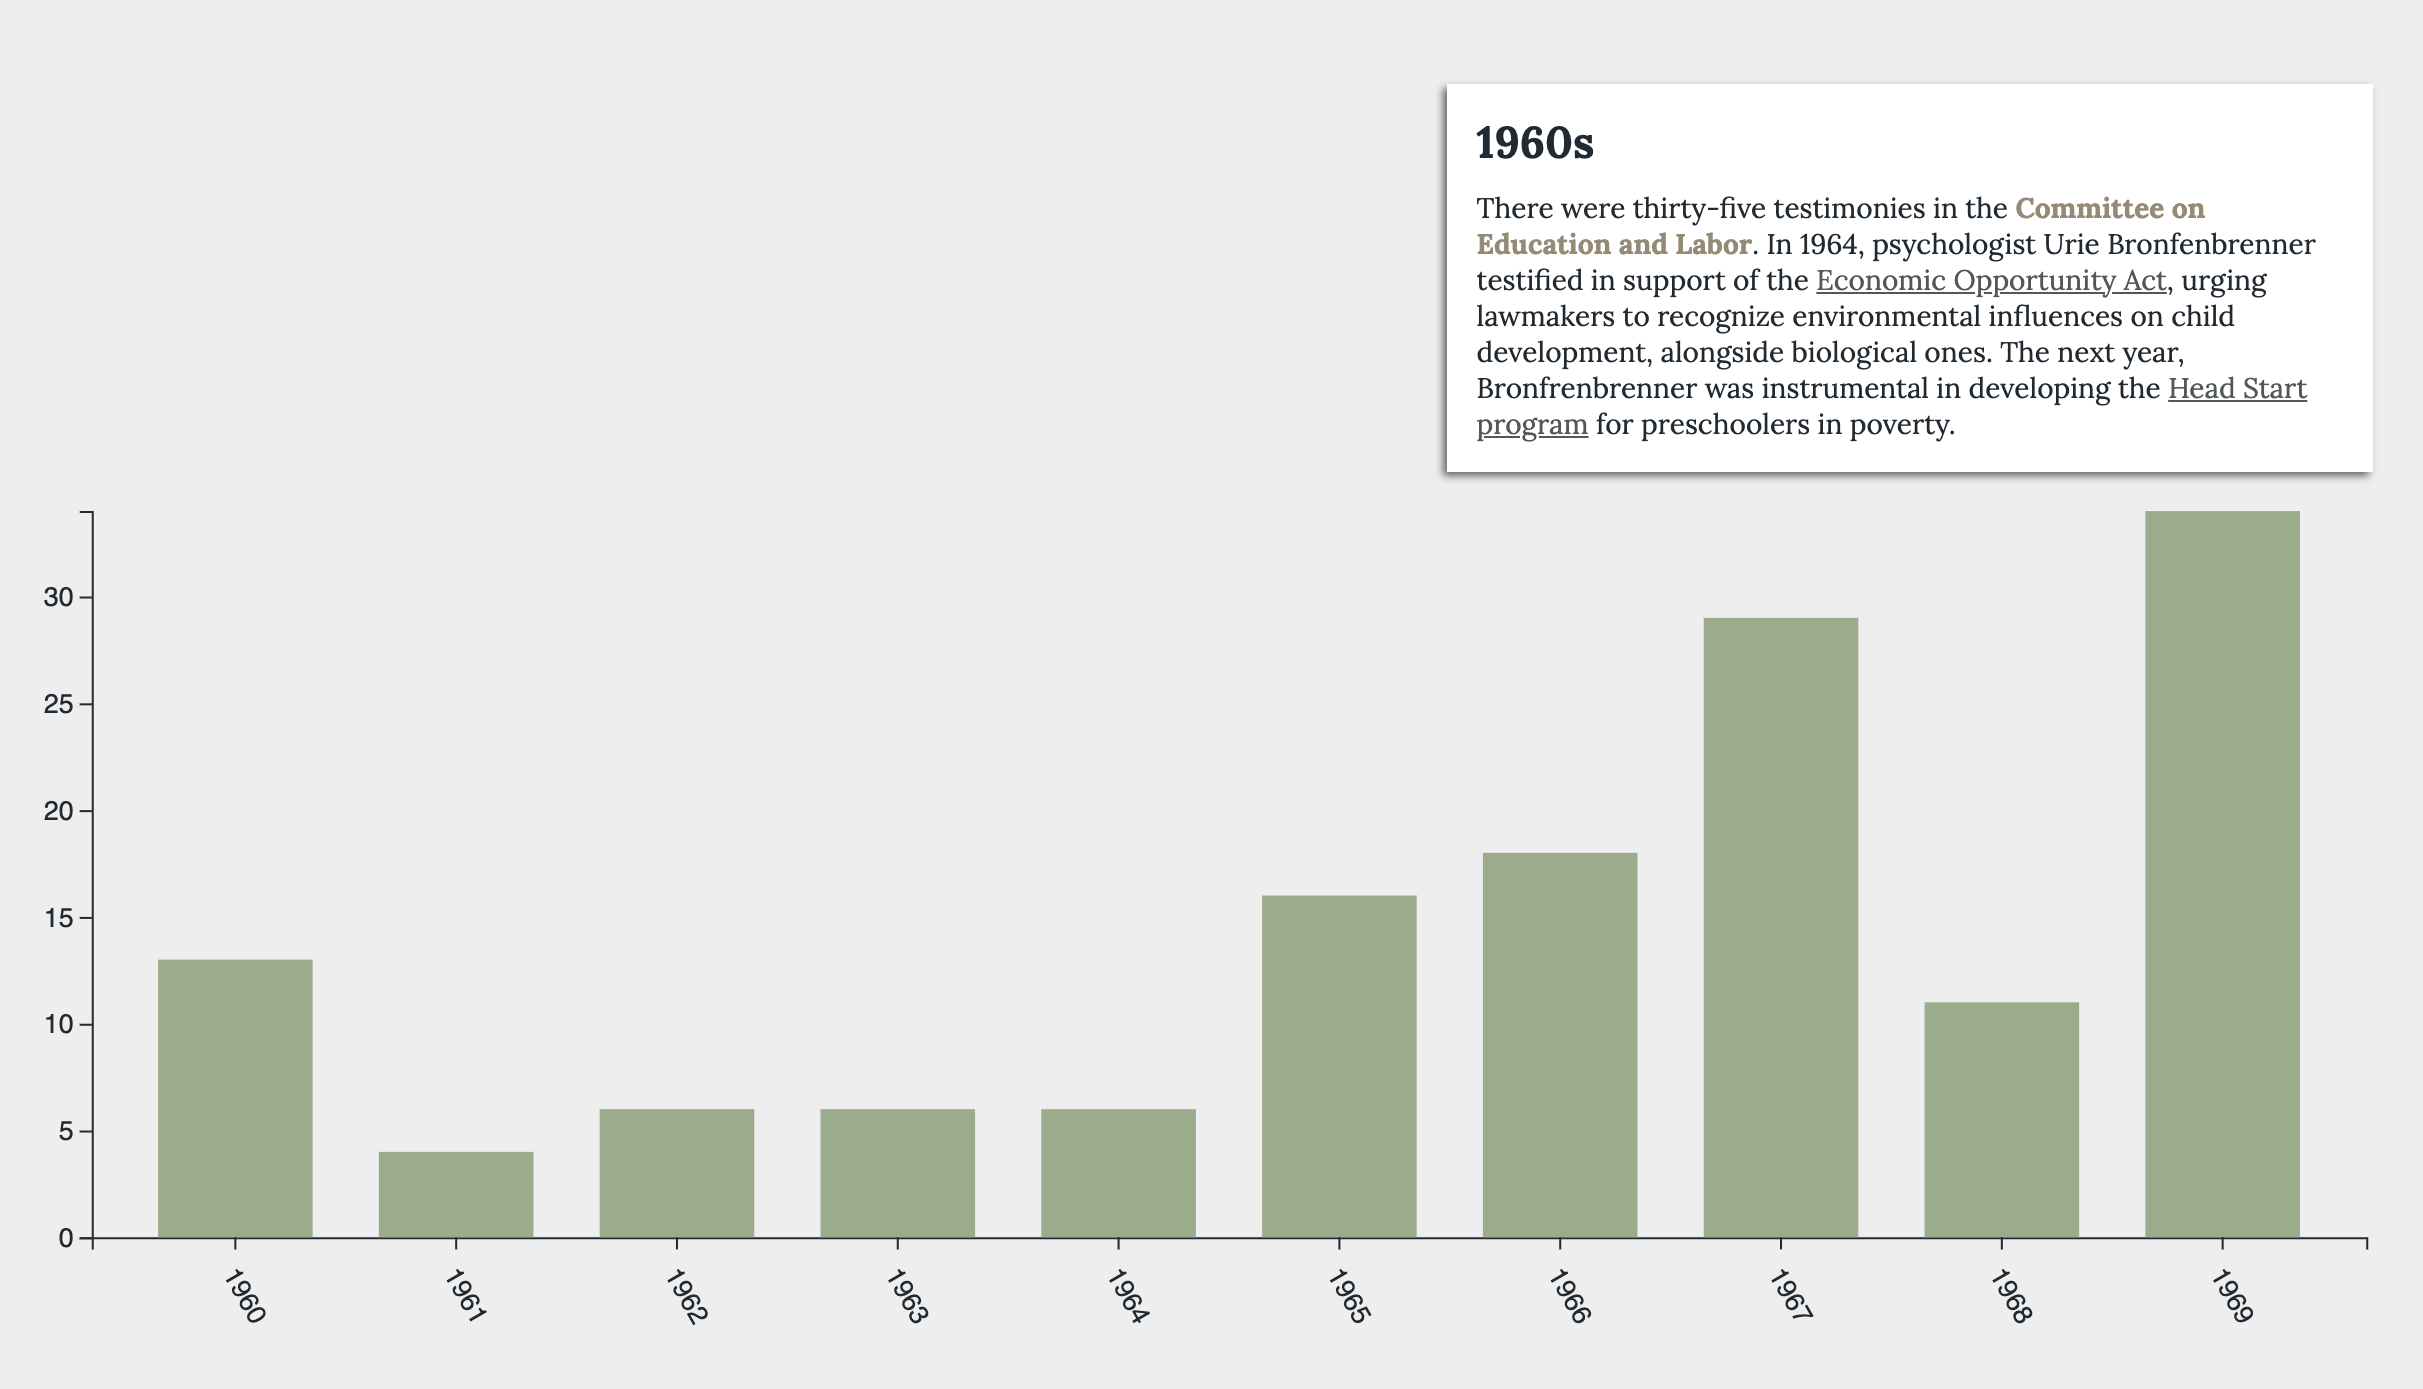
This project presents a brief history of US Congressional testimony given by psychologists 1946-2016. Highlights from each decade appear upon scrolling. Users can explore individual testimonies by brushing the final bar chart to update the table below it. A tree diagram at the end shows key witnesses by committee.
🧰 Built with: D3.js, HTML/CSS
🗄️ Data source: Social Scientists Before Congress
🔗 View on Github Pages
Stepping Out
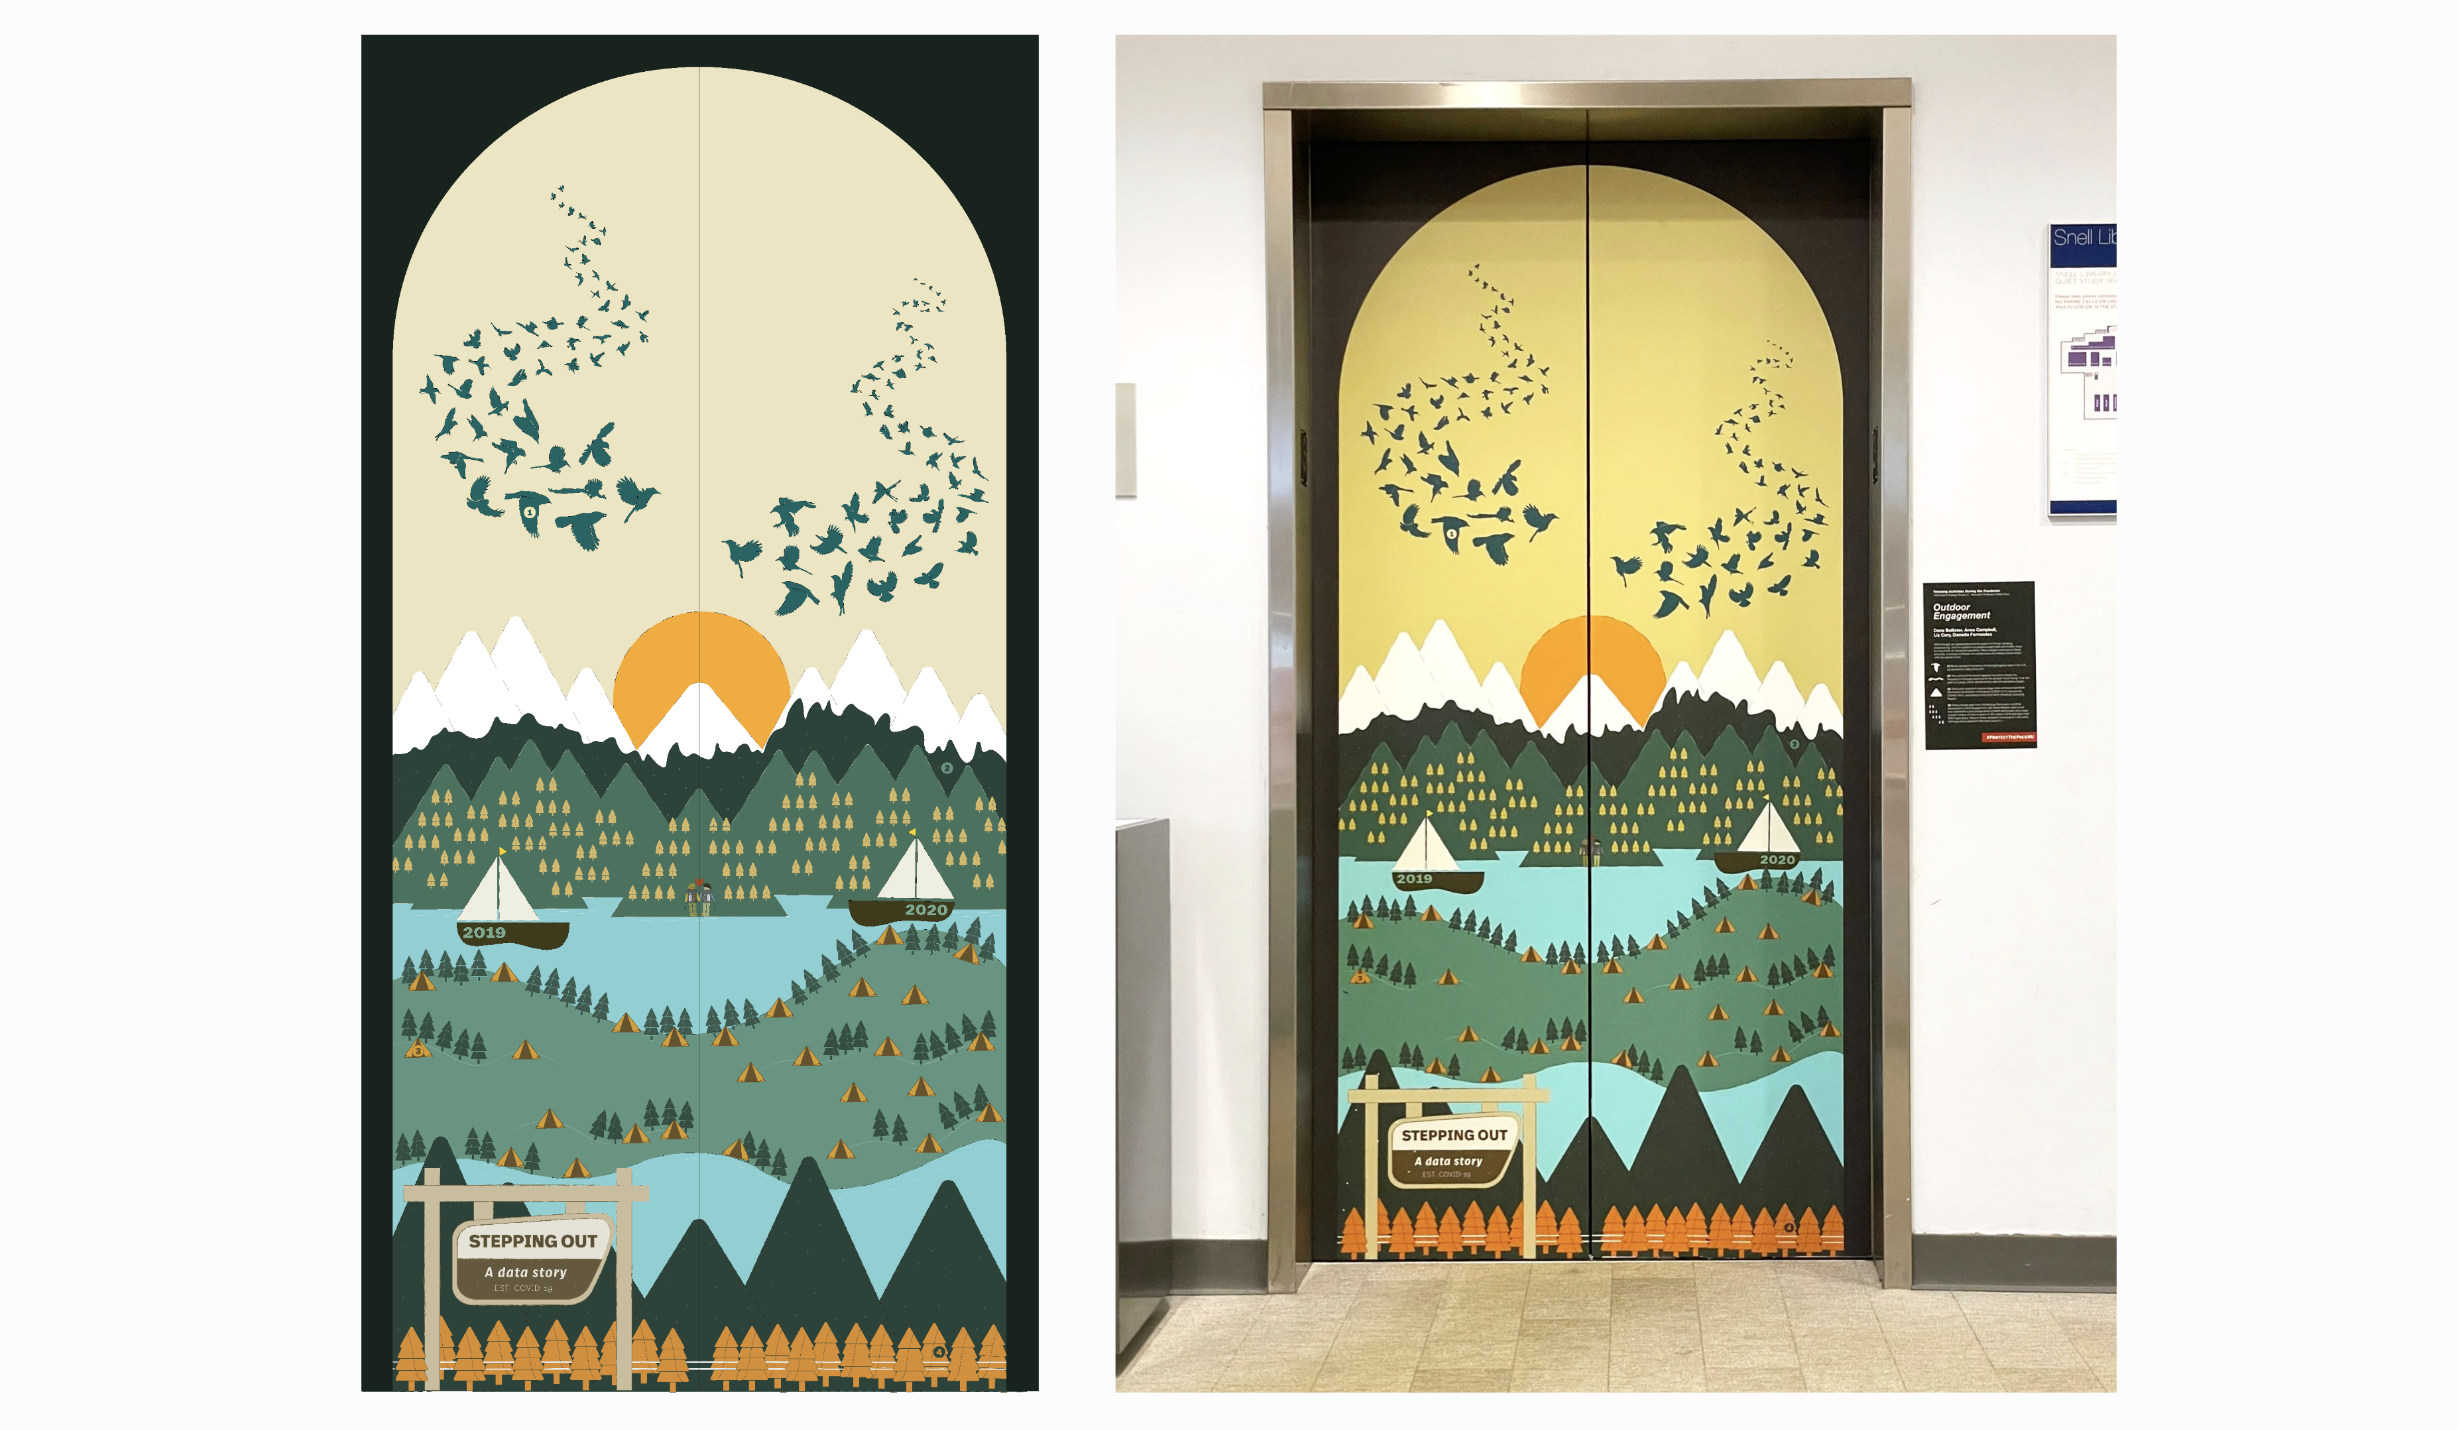
As part of Northeastern University’s “Protect The Pack” COVID-19 marketing campaign in the spring of 2021, my collaborators and I were asked to contribute a data-informed art installation for an elevator door the library. We decided to explore datasets illustrating the uptick in outdoor activity during the pandemic lockdowns of 2020.
My role included:
- Sourcing and exploring data, including one of our final sources from the National Recreation and Park Association and some that didn’t fit in the end (e.g., COVID-19 Community Mobility Reports)
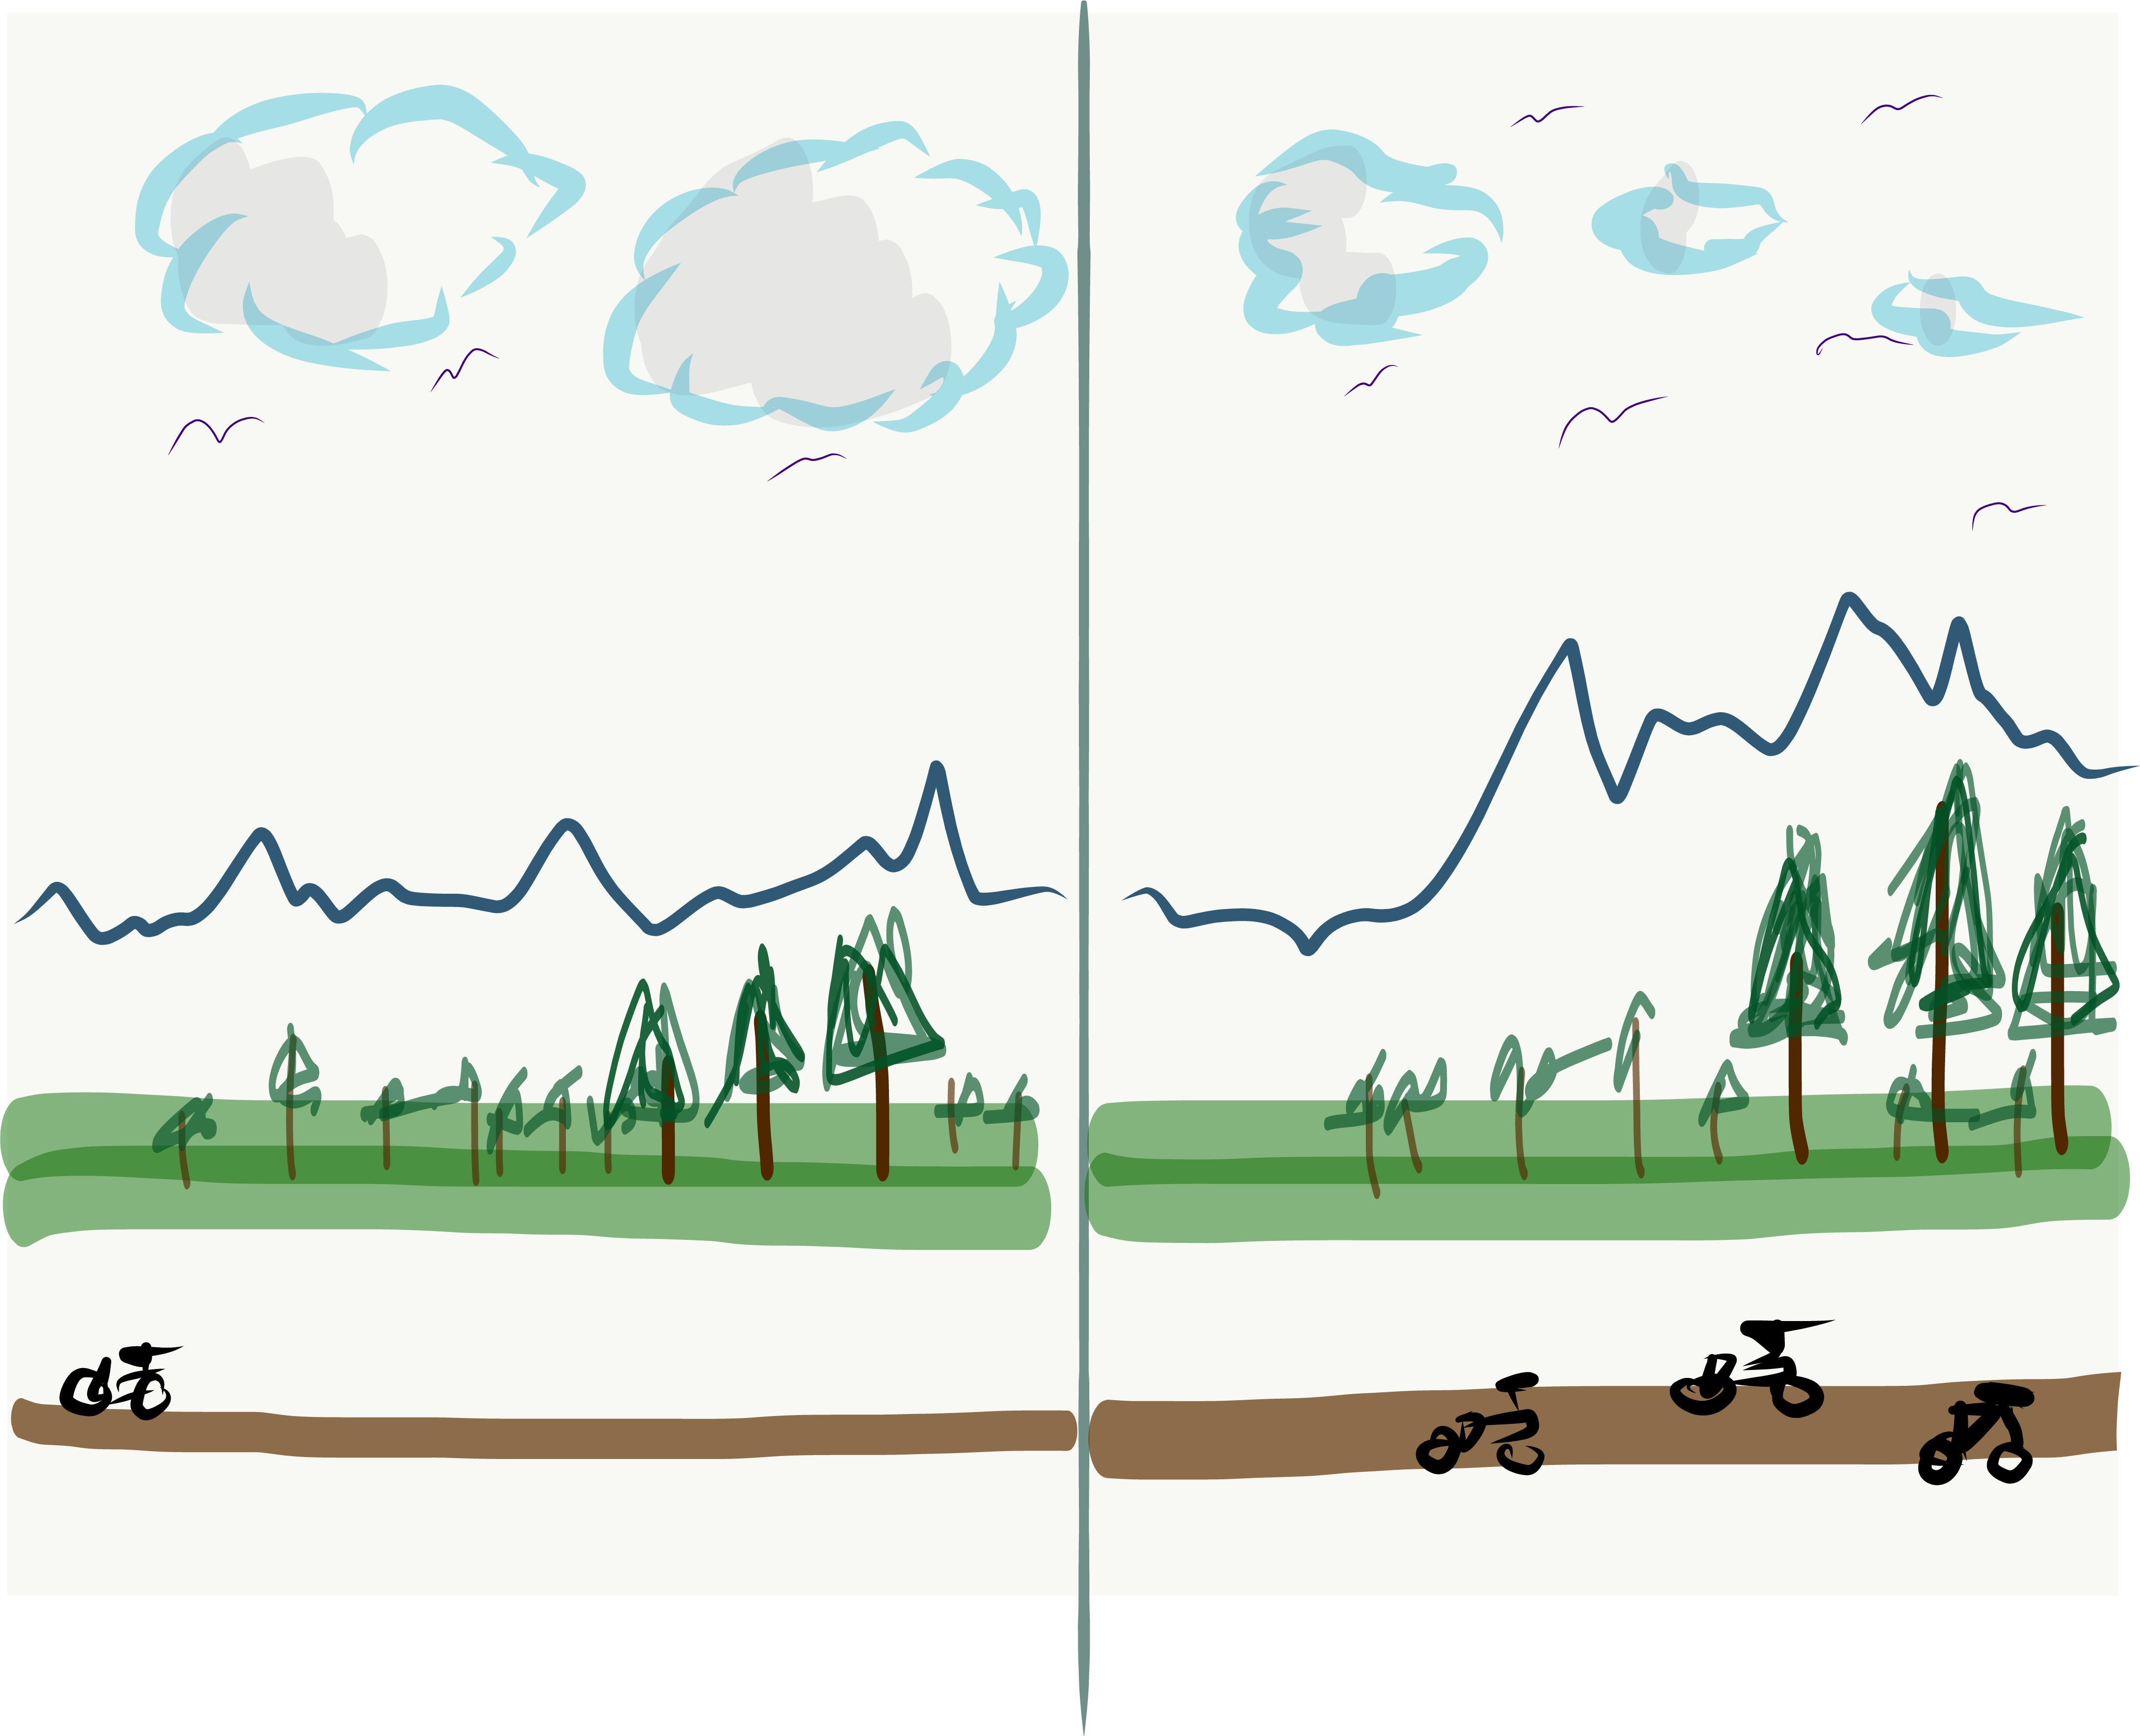
- Creating early sketches exploring potential layouts to share with the campaign team
- Illustrating vector trees and tents to encode two of our four datasets
- Iterating on layout designs and colors with my collaborators
🏆 2022 Information is Beautiful Awards Longlist
🤝 Collaborators: Daniella Fernandes, Anna Campbell, Dana Bullister
🧰 Built with: Adobe Illustrator
🗄️ Data sources: 1) frequency of bird sightings by type in the U.S. as reported to iNaturalist.com in 2019 and 2020; 2) frequency of Google searches for the phrase ‘local hiking’ 2019, 2020; 3) share of leisure trips accounted for by camping Pre- and Post- COVID-19, per Kampgrounds of America’s 2020 North American Camping Special Report: North American Camping and the Effects of COVID-19; 4) number of trips made to National Parks in 2019 and 2020 coded from 1 - 51+ visits, per the National Recreation and Park Association’s 2020 Engagement With Parks Report.
🔗 PDF
Trans Rights
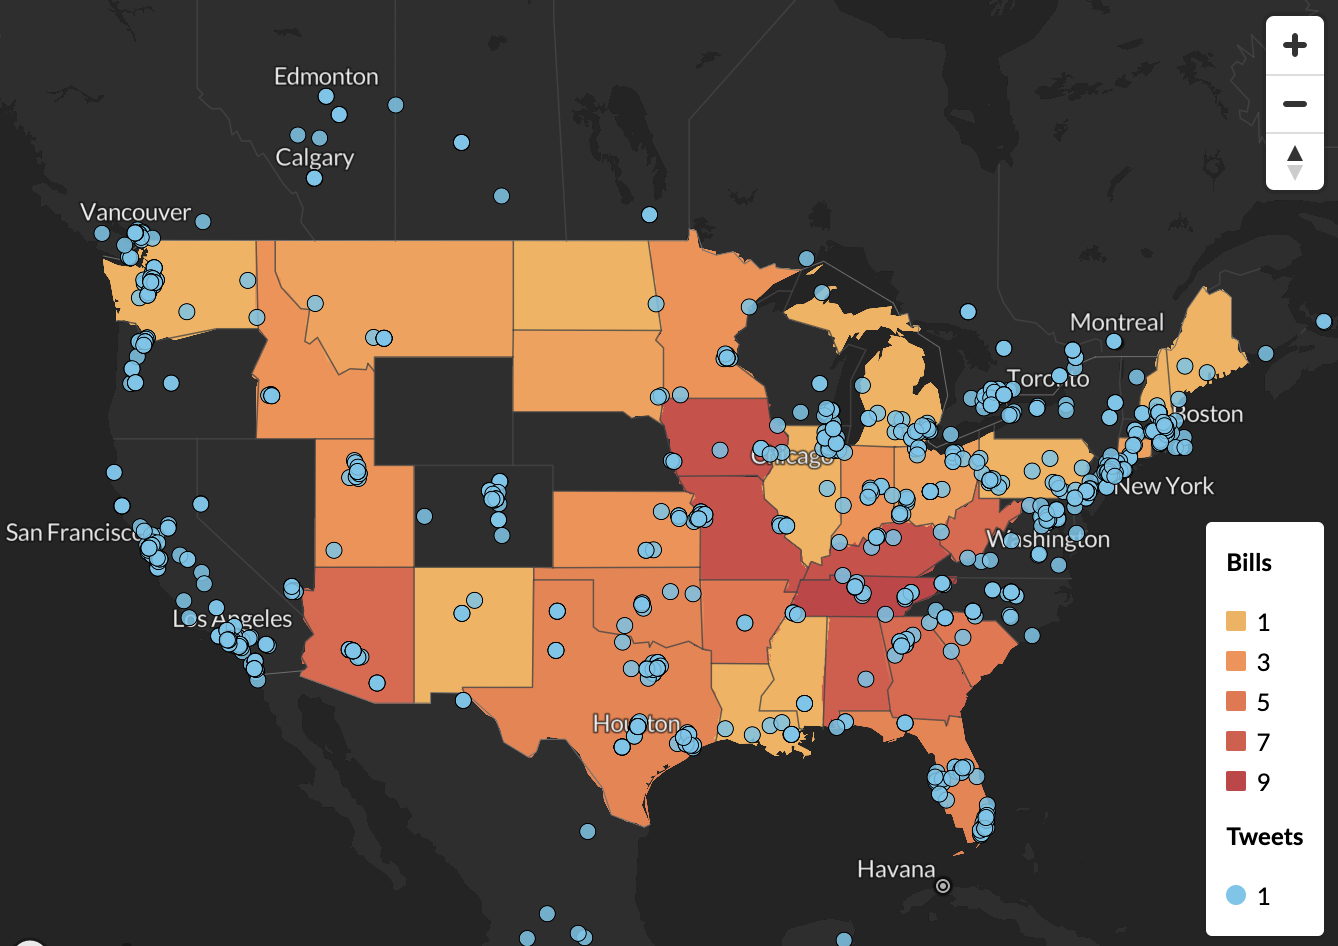
This project visualizes the uptick in anti-trans bills filed by US legislators in the 2020 and 2021 legislative sessions. Compared to the previous two years, anti-trans legislation filed during during these sessions dramatically increased to a magnitude never before seen. These sessions also represented the start of an ongoing wave of attacks on trans kids’ ability to play sports and receive gender-affirming healthcare. My teammate and I created this project in a graduate information design studio course.
My role included:
- Querying tweets that included “#TransRightsAreHumanRights” by customizing template JavaScript code provided with the assignment
- Co-designing the page layout and selecting visualization types
- Creating the map with Twitter and ACLU data
- Researching and copywriting
- Building the final page with HTML/CSS
🤝 Collaborators: Rachel Peterson
🧰 Built with: JavaScript, HTML/CSS, Mapbox
🗄️ Data source: Twitter API, ACLU Legislation Affecting LGBTQ Rights Across the Country
🔗 View on Github Pages
Vagus Nerve

The tenth cranial nerve in humans is called the “vagus,” meaning “wandering” in Latin. True to its name, the vagus travels farther than any other nerve in the autonomic nervous system. Some of its most distant stops are in the gut. There, its “afferent” fibers—those traveling up from the body to the brain—sense a mix of mechanical, chemical, and thermal information critical for regulating metabolism and eating.
These illustrations cover the gross anatomy of the vagus its target organs in the gut. The key aim is to aid scientific exploration by synthesizing and simplifying complex anatomical information spread across many research papers.
🧰 Built with: Adobe Illustrator
🔗 SVGs: Left nerve, Right nerve
Other Work
COVIC
During the COVID-19 pandemic, I tagged and archived hundreds of visualizations for Northeastern’s COVID-19 Online VIsualization Collection (COVIC). The collection—which now contains over 10,000 figures—serves as a research tool, allowing users to filter charts and illustrations by type, interactive elements, and intended message.
+ + +
R Programming
Over the past several years, I’ve come to really enjoy tinkering with new R packages and sharing what I learn. For anyone interested in getting started with R, here’s a list of free online courses I update every few months: Free R Programming and Statistics Courses.