Birdwatching with public health binoculars
It’s been a brutal winter in Boston. To break up long stints of hibernation, I’ve been taking walks through nearby parks and doing some birdwatching. I don’t bring any binoculars, field guides, or expert knowledge, just a general curiosity about the inner lives of my neighborhood geese and ducks.
So, what are you honking about today? Are you still proud of those Sully-Sullenberger-suave river landings, or do they kinda get old? Are you feeling at all… under the weather?
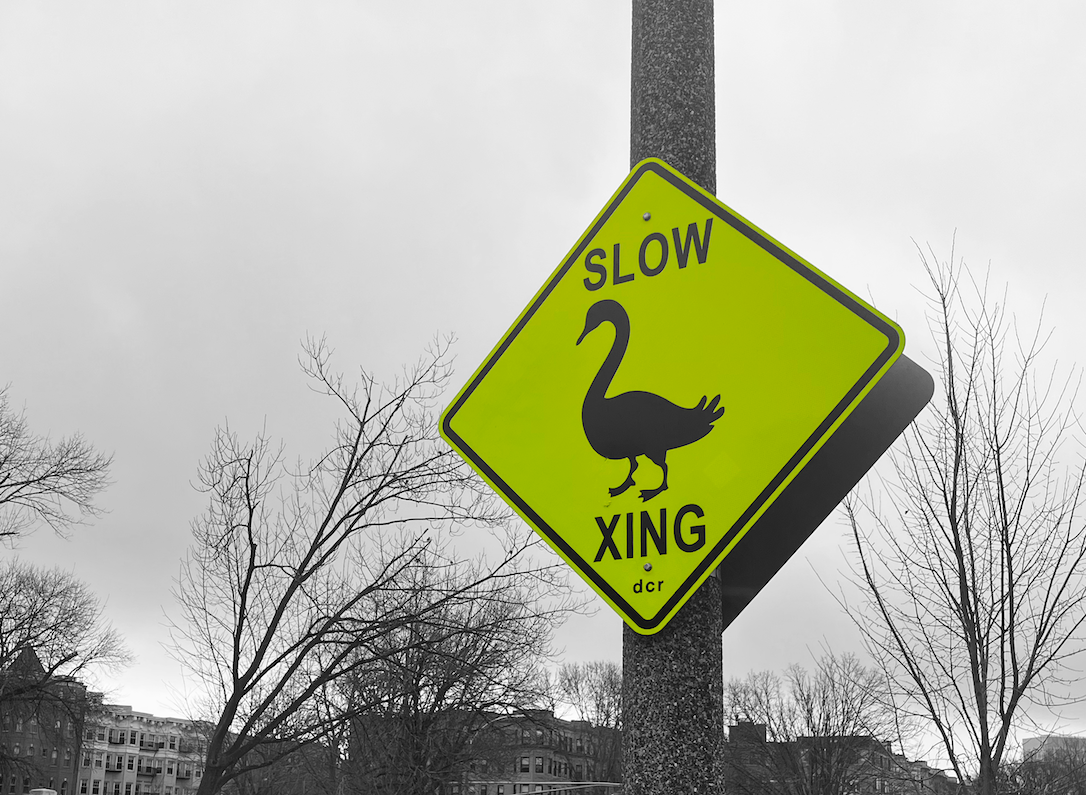
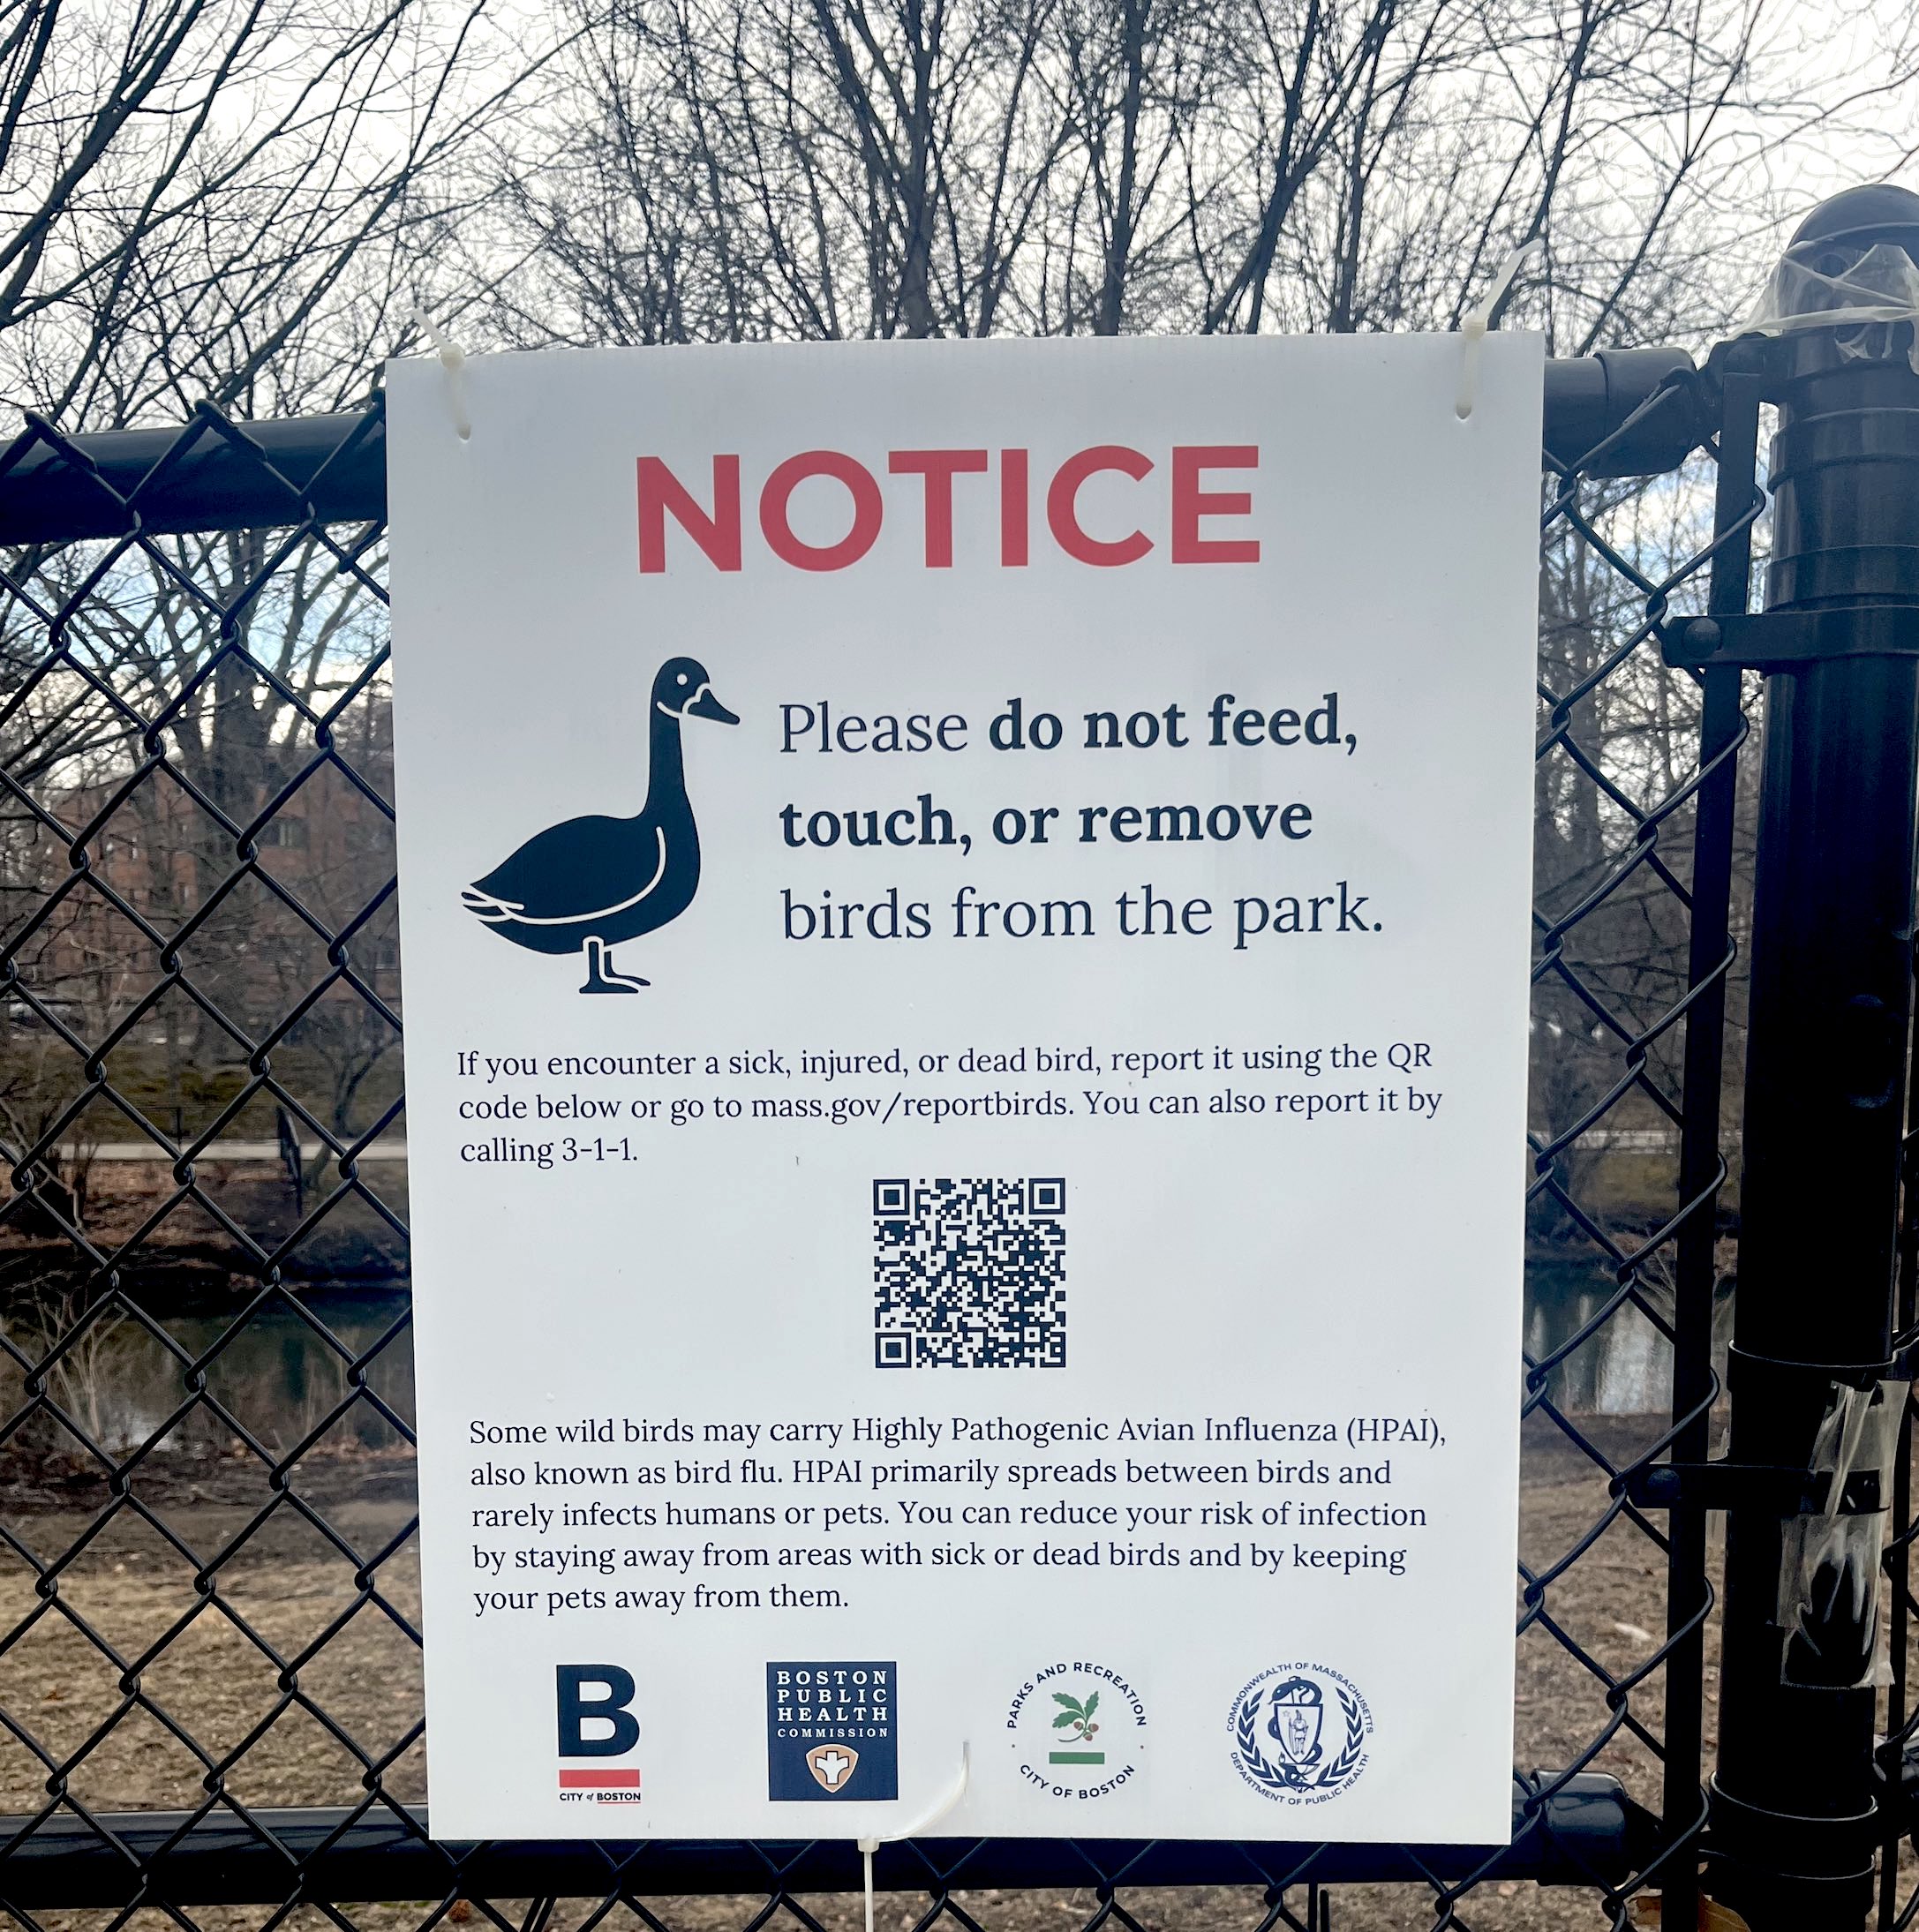
Since the last week of January, when city officials started posting public notices in parks about bird flu — per updated state-level guidance — I’ve fixated more and more on that last one. Experts say the current outbreak prompting this new guidance is the largest ever in Massachusetts, classified as “widespread.” It turns out that cases are mostly cropping up in waterfowl, like geese and ducks.
Just last week I made my first 311 request for pickup of a fallen duck I spotted on an icy river bank. It made me wonder: is Boston now seeing a rise in 311 case requests for dead birds, given the statewide outbreak (and extra prompting from the city for resident reports)? How does request volume now compare to the same time in previous years?
Fortunately, Boston has an excellent public data repository of 311 requests stretching back over a decade. While we’re still a bit too early on from the new guidance to track meaningful trends, I’ve started to tuck into the city APIs to visualize what’s been submitted so far.
To do this, I first wrote a script in R to grab data from 2020 onward using the resource ID for each year’s dataset, found on their respective summary pages.
resourceIDs <- c(
  yr2020 = "6ff6a6fd-3141-4440-a880-6f60a37fe789",
  yr2021 = "f53ebccd-bc61-49f9-83db-625f209c95f5",
  yr2022 = "81a7b022-f8fc-4da5-80e4-b160058ca207",
  yr2023 = "e6013a93-1321-4f2a-bf91-8d8a02f1e62f",
  yr2024 = "dff4d804-5031-443a-8409-8344efd0e5c8",
  yr2025 = "9d7c2214-4709-478a-a2e8-fb2020a5bb94"
  )

counter <- 0
limit <- 30000
dat_311_records_list <- list()

for(curr_ID in 1:length(resourceIDs)) {
  offset <- c("")
  for(call_num in 1:10){
    counter <- counter + 1
    if (call_num > 1) {offset <- paste0("&offset=",(call_num-1)*limit)}

    url <- paste0("https://data.boston.gov/api/3/action/datastore_search?",
                  paste0("&limit=",limit),
                  offset,
                  paste0("&resource_id=",resourceIDs[curr_ID]))

    dat_311_call <- fromJSON(url)
    call_records <- dat_311_call$result$records
    dat_311_records_list[[counter]] <- call_records
  }
}

dat_311_records <- dat_311_records_list %>% bind_rows()
Then I subsetted this data for just the dead bird reports. I began by filtering for the relevant request type, Pick up Dead Animal. Then came the bird-specific part. This turned out to be a bit tricker than anticipated, as I learned in the process that this data doesn’t include a critical column: the request description. This is where I would have expected constituents to write things like “Dead duck on the river bank.” I did email the city about potentially adding this field to future releases, though I’m sure there are good privacy-related reasons to omit it for now. With this limitation, I turned instead to the Closure Reason field, where 311 responders report the work they did to justify ticket closure. Tons of bird stuff! “Dead bird picked up.” “Dead turkey removed from sidewalk.” I filtered on a regular expression with just about every common bird term I could think of (inspired in part by this list), and voilà: 902 dead bird pickup requests since Jan 1, 2020.
dat_311_dead_animals <- dat_311_records %>%
  filter(type %in% "Pick up Dead Animal") %>%
  mutate(open_dt = ymd_hms(open_dt),
         open_date = date(open_dt),
         year = year(open_date),
         month = month(open_date, label=TRUE),
         yearmon = floor_date(open_date, unit = "month"),
         .before = "open_dt"
  )

dat_311_dead_birds <- dat_311_dead_animals %>%
  filter(grepl(paste(c("goose","gooses","geese","bird","birds","brid","brids","duck","ducks","hawk","hawks","falcon","falcons",
                       "turkey","turkeys","pidgeon","pigeon","pigeons","pigon","pigons","gull","gulls","seagull","seagulls",
                       "sparrow","sparrows", "swan","swans","dove","doves","robin","robins","mallard","mallards",
                       "heron","herons","jay","jays","starling","starlings","hummingbird","hummingbirds","chicken","chickens",
                       "crow","crows","owl","owls", "scoup","scoups","osprey","ospreys",
                       "eagle","eagles"), collapse="|"), closure_reason))
There’s likely some more cleaning to do here, as I’m not sure this bird word list is exhaustive, and I haven’t decided what to do about “invalid” reports where the 311 responder couldn’t find the bird, or found it on on private property. (For now, these are all still included; after all, the requester still reported seeing a dead bird somewhere, and it’s very likely these reports undercount the total volume of avian deaths in the city).
When we plot the reports as a time series, there are clear seasonal trends. More requests for dead bird pickups in the warmer months, less in the colder ones. In 2025 so far, it looks like we’re seeing a slight uptick in requests compared to the three winters prior. But this early on in the year, and with <20 reports per month, it’s hard to draw out anything significant just yet. I’m curious about what went on in May 2023 leading to an all-time high in requests. A quick bit of research didn’t yield anything conclusive.
This year’s requests to date have spanned almost all neighborhoods. It will be interesting as the months go on to see whether requests start clustering near waterways, where all the waterfowl hang out. It could also be interesting to chart the breakdown in requests by the specific bird words used — “duck,” “goose,” “turkey” — though it’s possible the general usage of “bird” could mask some of that variation.
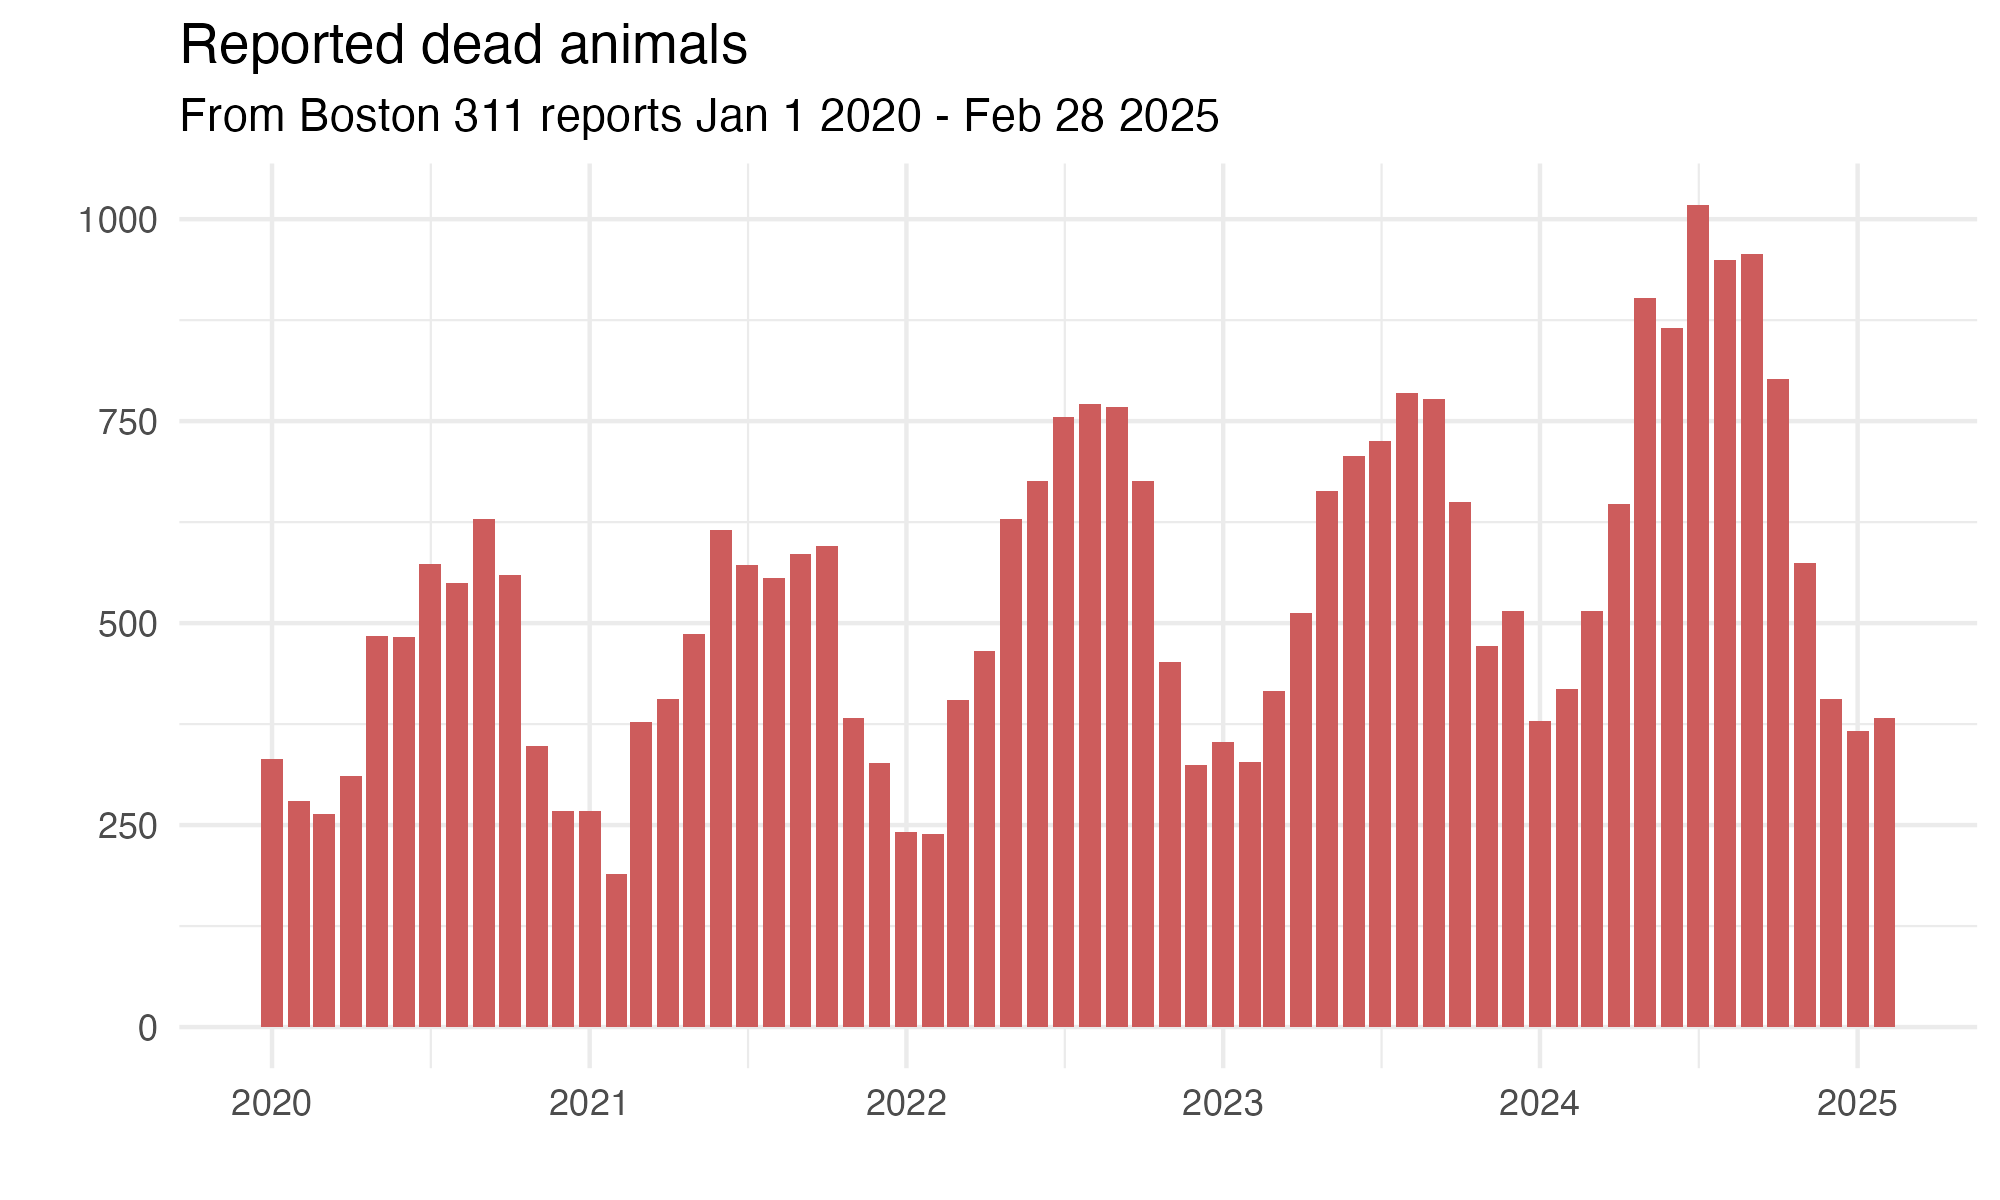
To better contextualize this data, I wanted to take a look at the base counts of Dead Animal Pick up 311 requests, as well as some data on bird flu detection in wild birds, more specifically. For this first question, I made a quick chart. Over the past few years, it looks like there’s been a general rise in dead animal pickup requests, not just those for birds, with a noticeable jump in the middle of 2024.
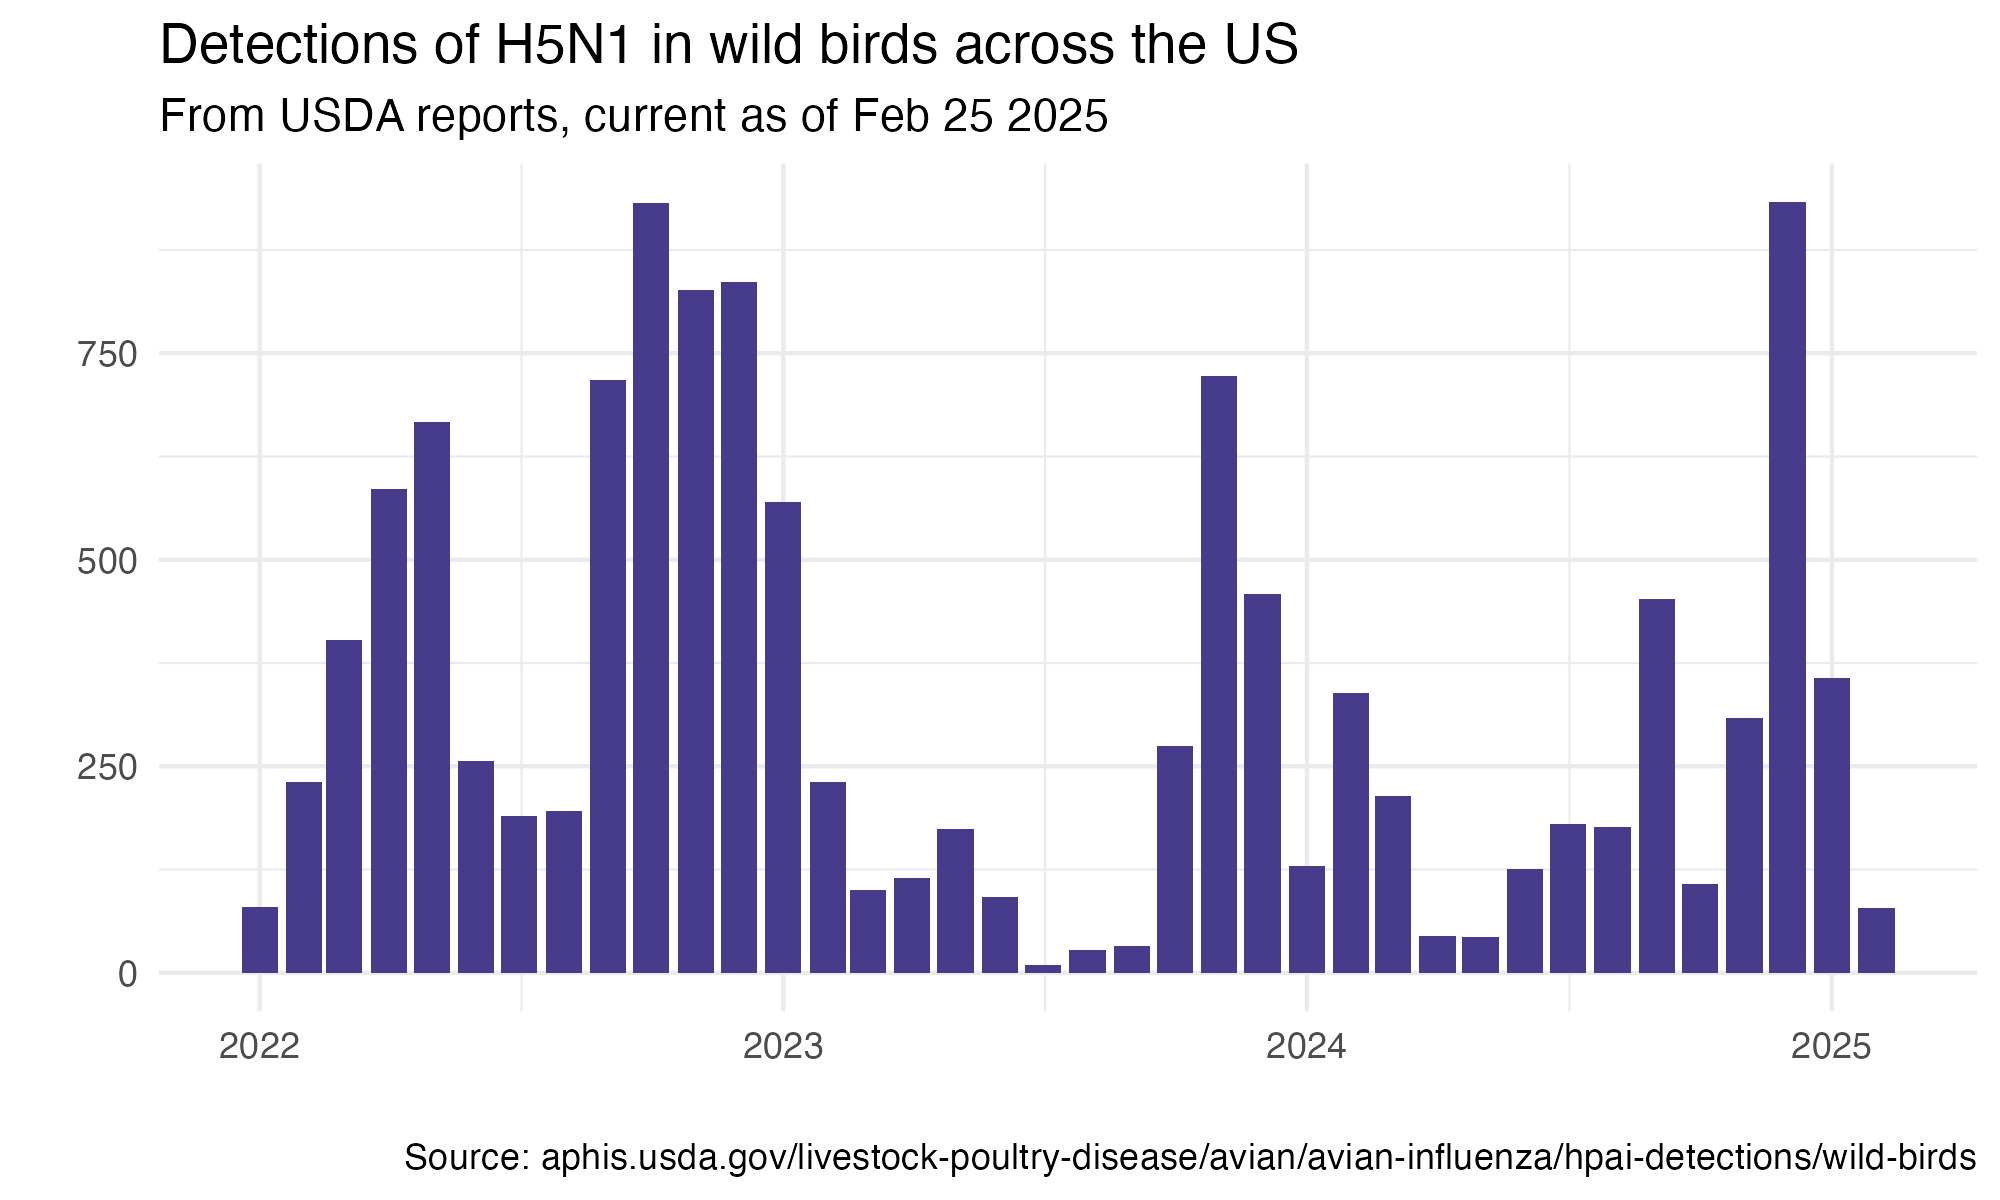
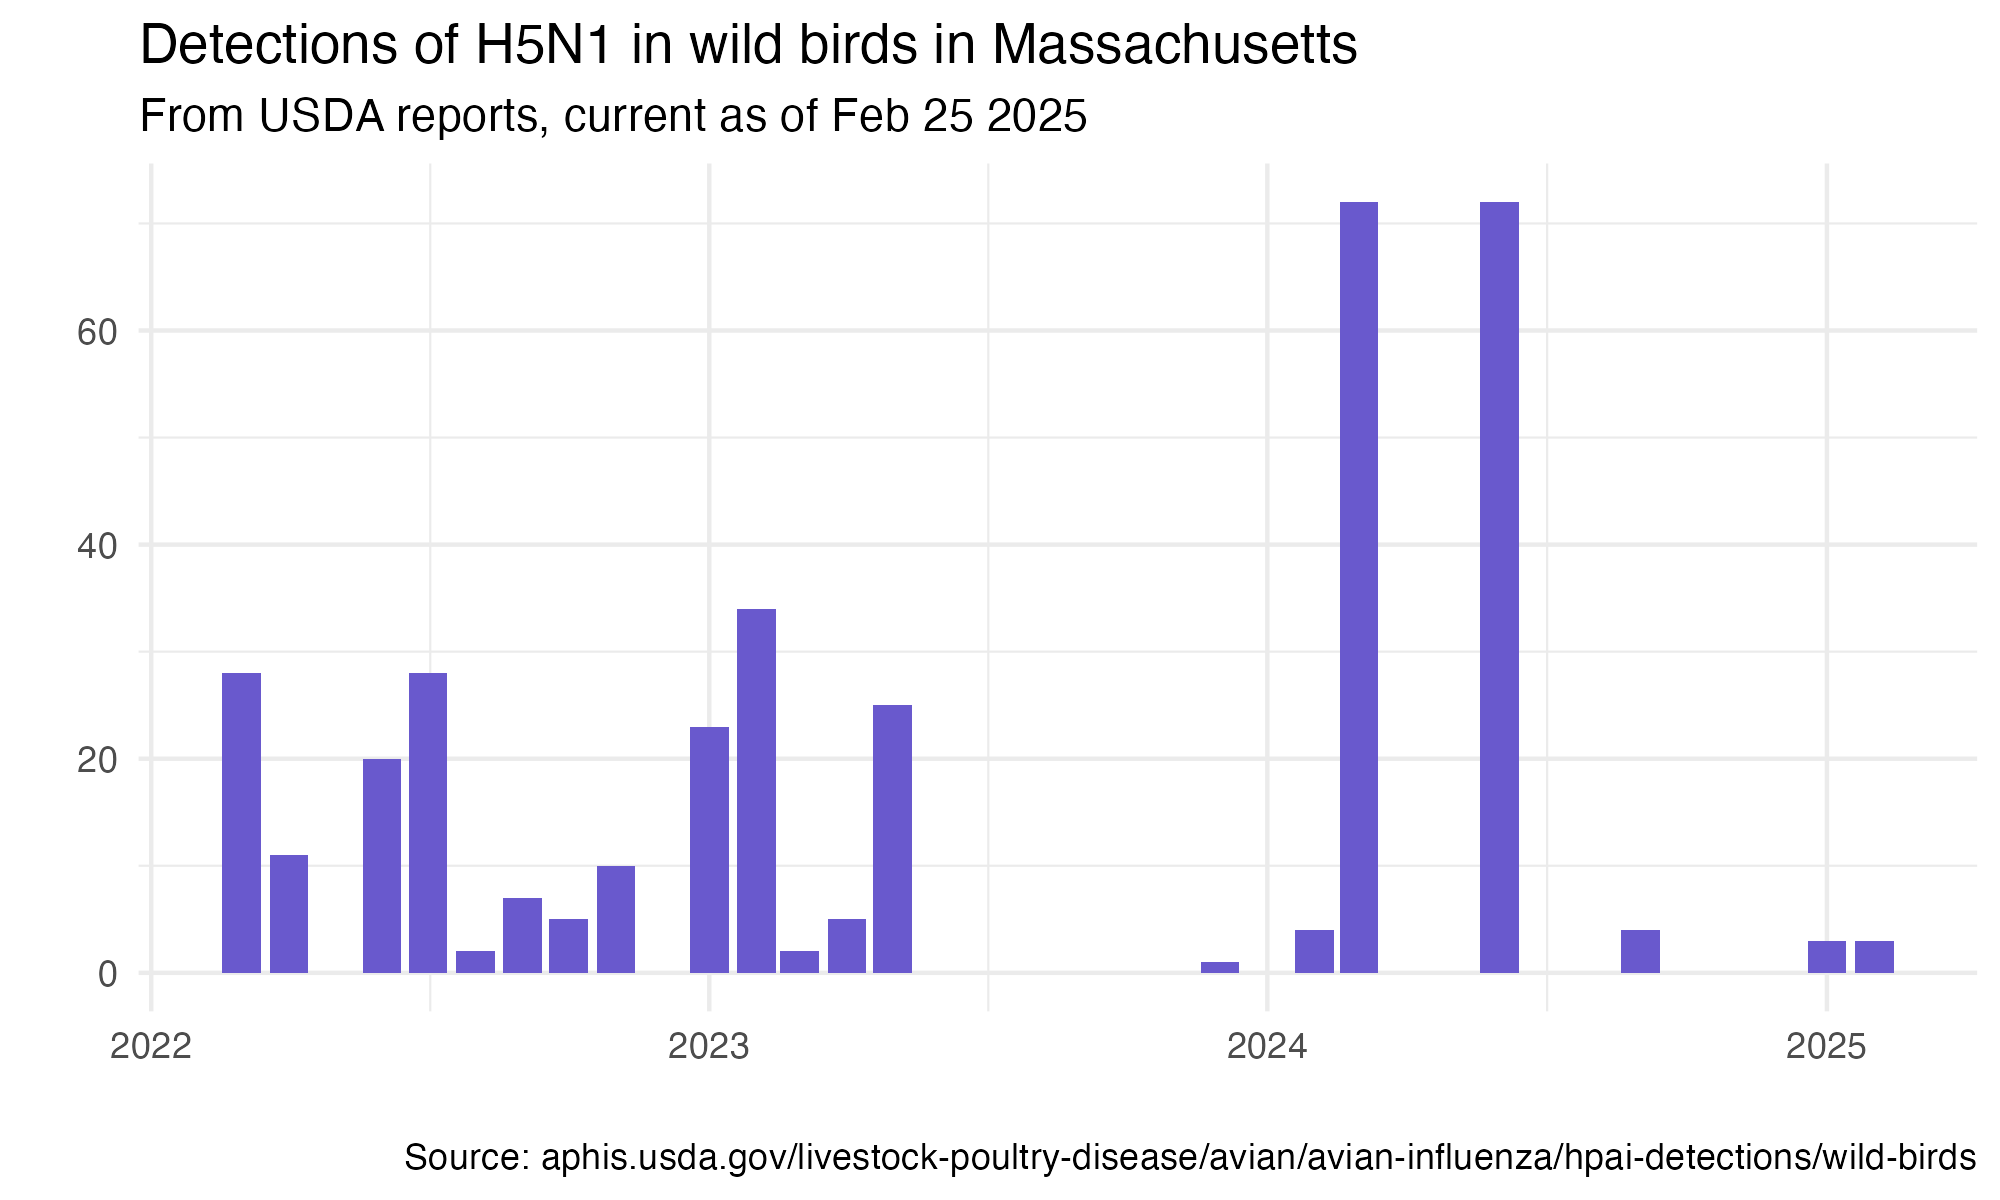
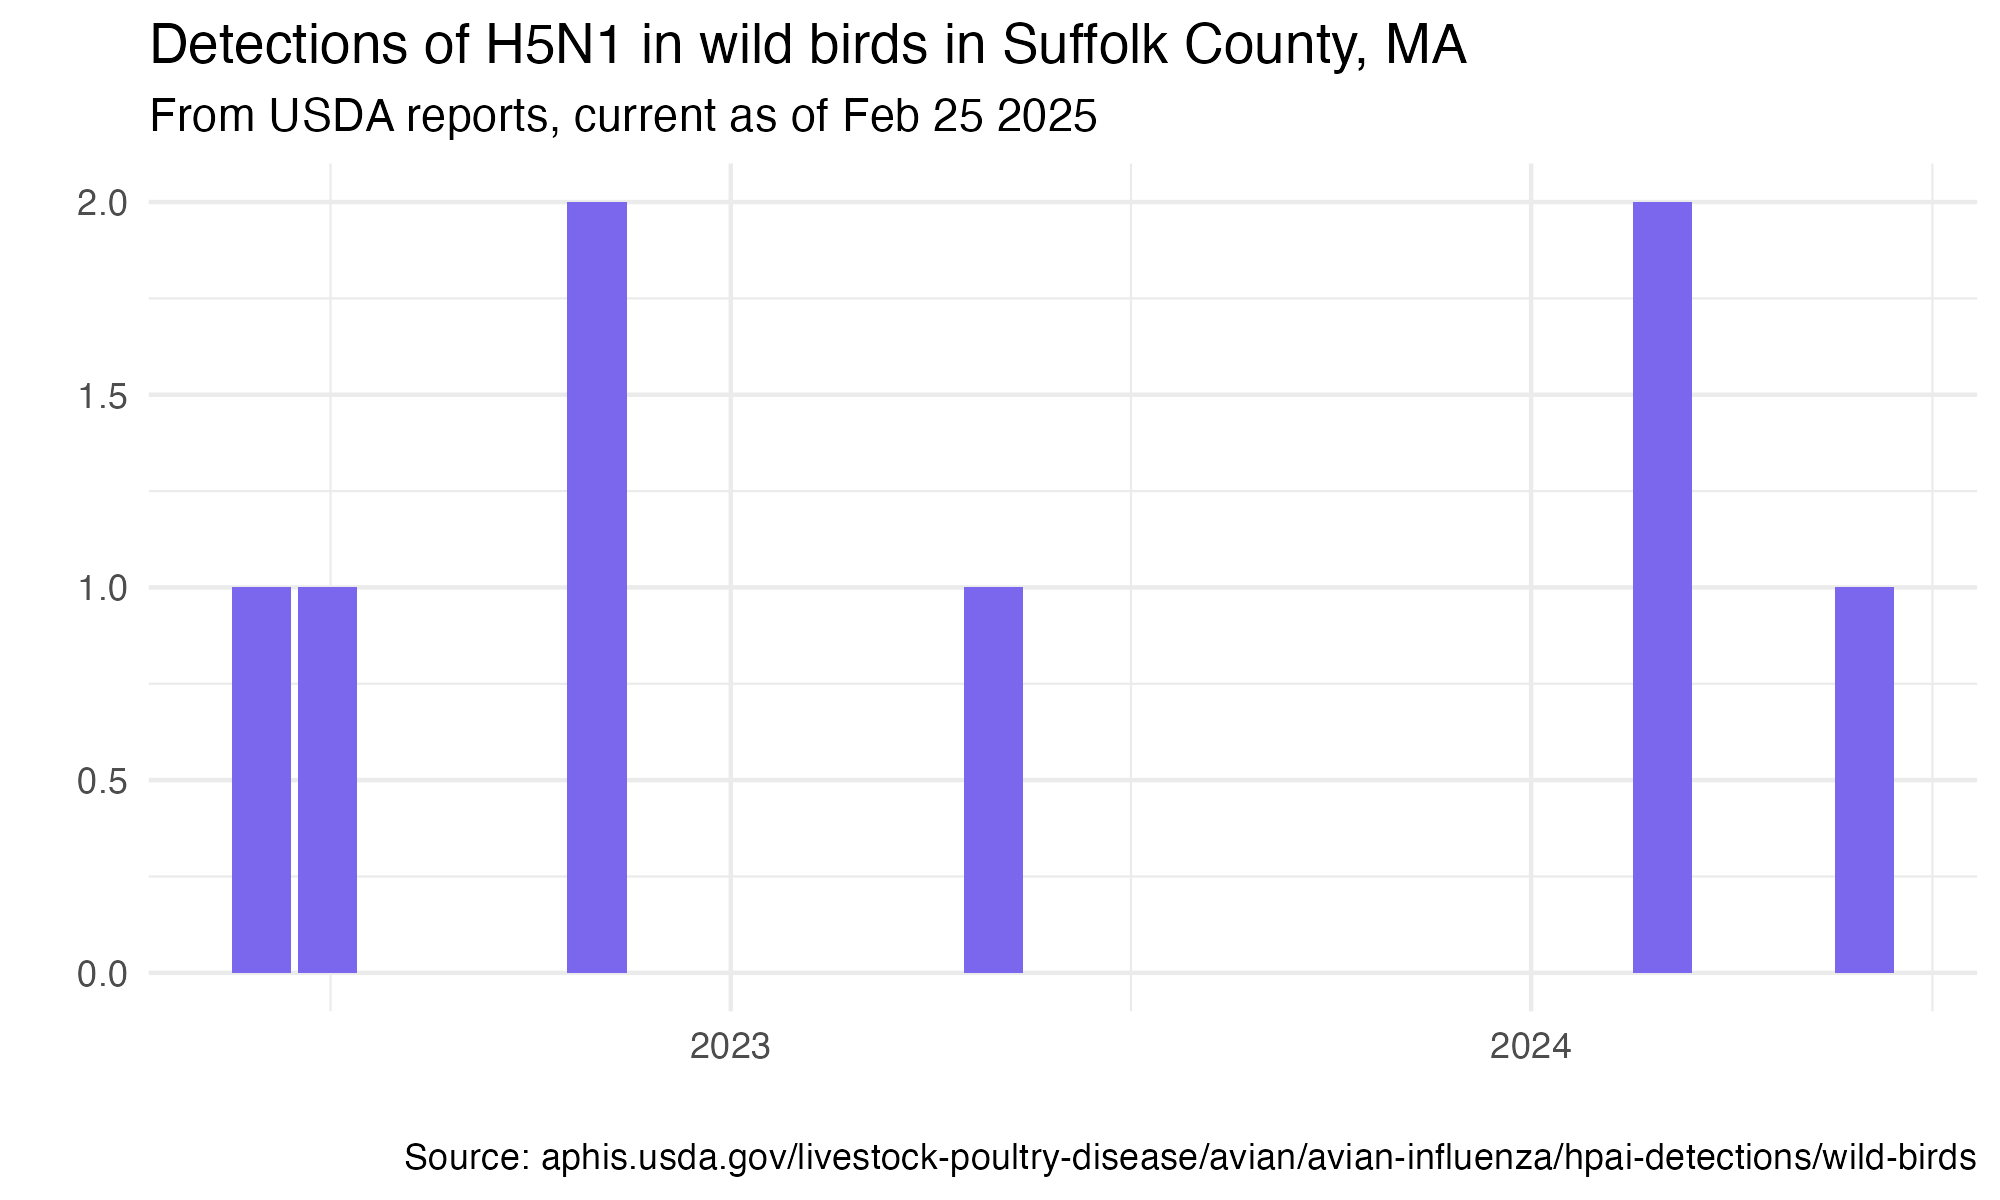
And now for bird flu case detection data. I read that MassWildlife is supervising the most thorough statewide monitoring of avian flu cases, though I didn’t find any public datasets they’ve published yet. Instead I looked at the USDA’s most recent reports. Overall, it looks like their bird flu detections 2022-2025 also have some semblance of seasonal trends with a big spike this past December. I was surprised though that these data don’t seem to account for the current outbreak Massachusetts, let alone Suffolk County (where Boston is located). Maybe a delay in reporting or confirmatory testing?
In another few weeks, I’ll check back to see where things stand with both our 311 requests and the USDA data. If anyone closer to the problem has some insight, I’d love to chat.
👋🏻 Thanks for reading!