GINKGO BIOWORKS
Data products for pathogen tracking
As a UX designer for the Biosecurity unit at Ginkgo Bioworks, I took data-centered digital products from zero to one, supporting the company in its transition from COVID-19 testing in schools to proactive pathogen monitoring at travel hubs around the globe.
Ask me about my process & approach.
GINKGO BIOWORKS
Color system for data visualization
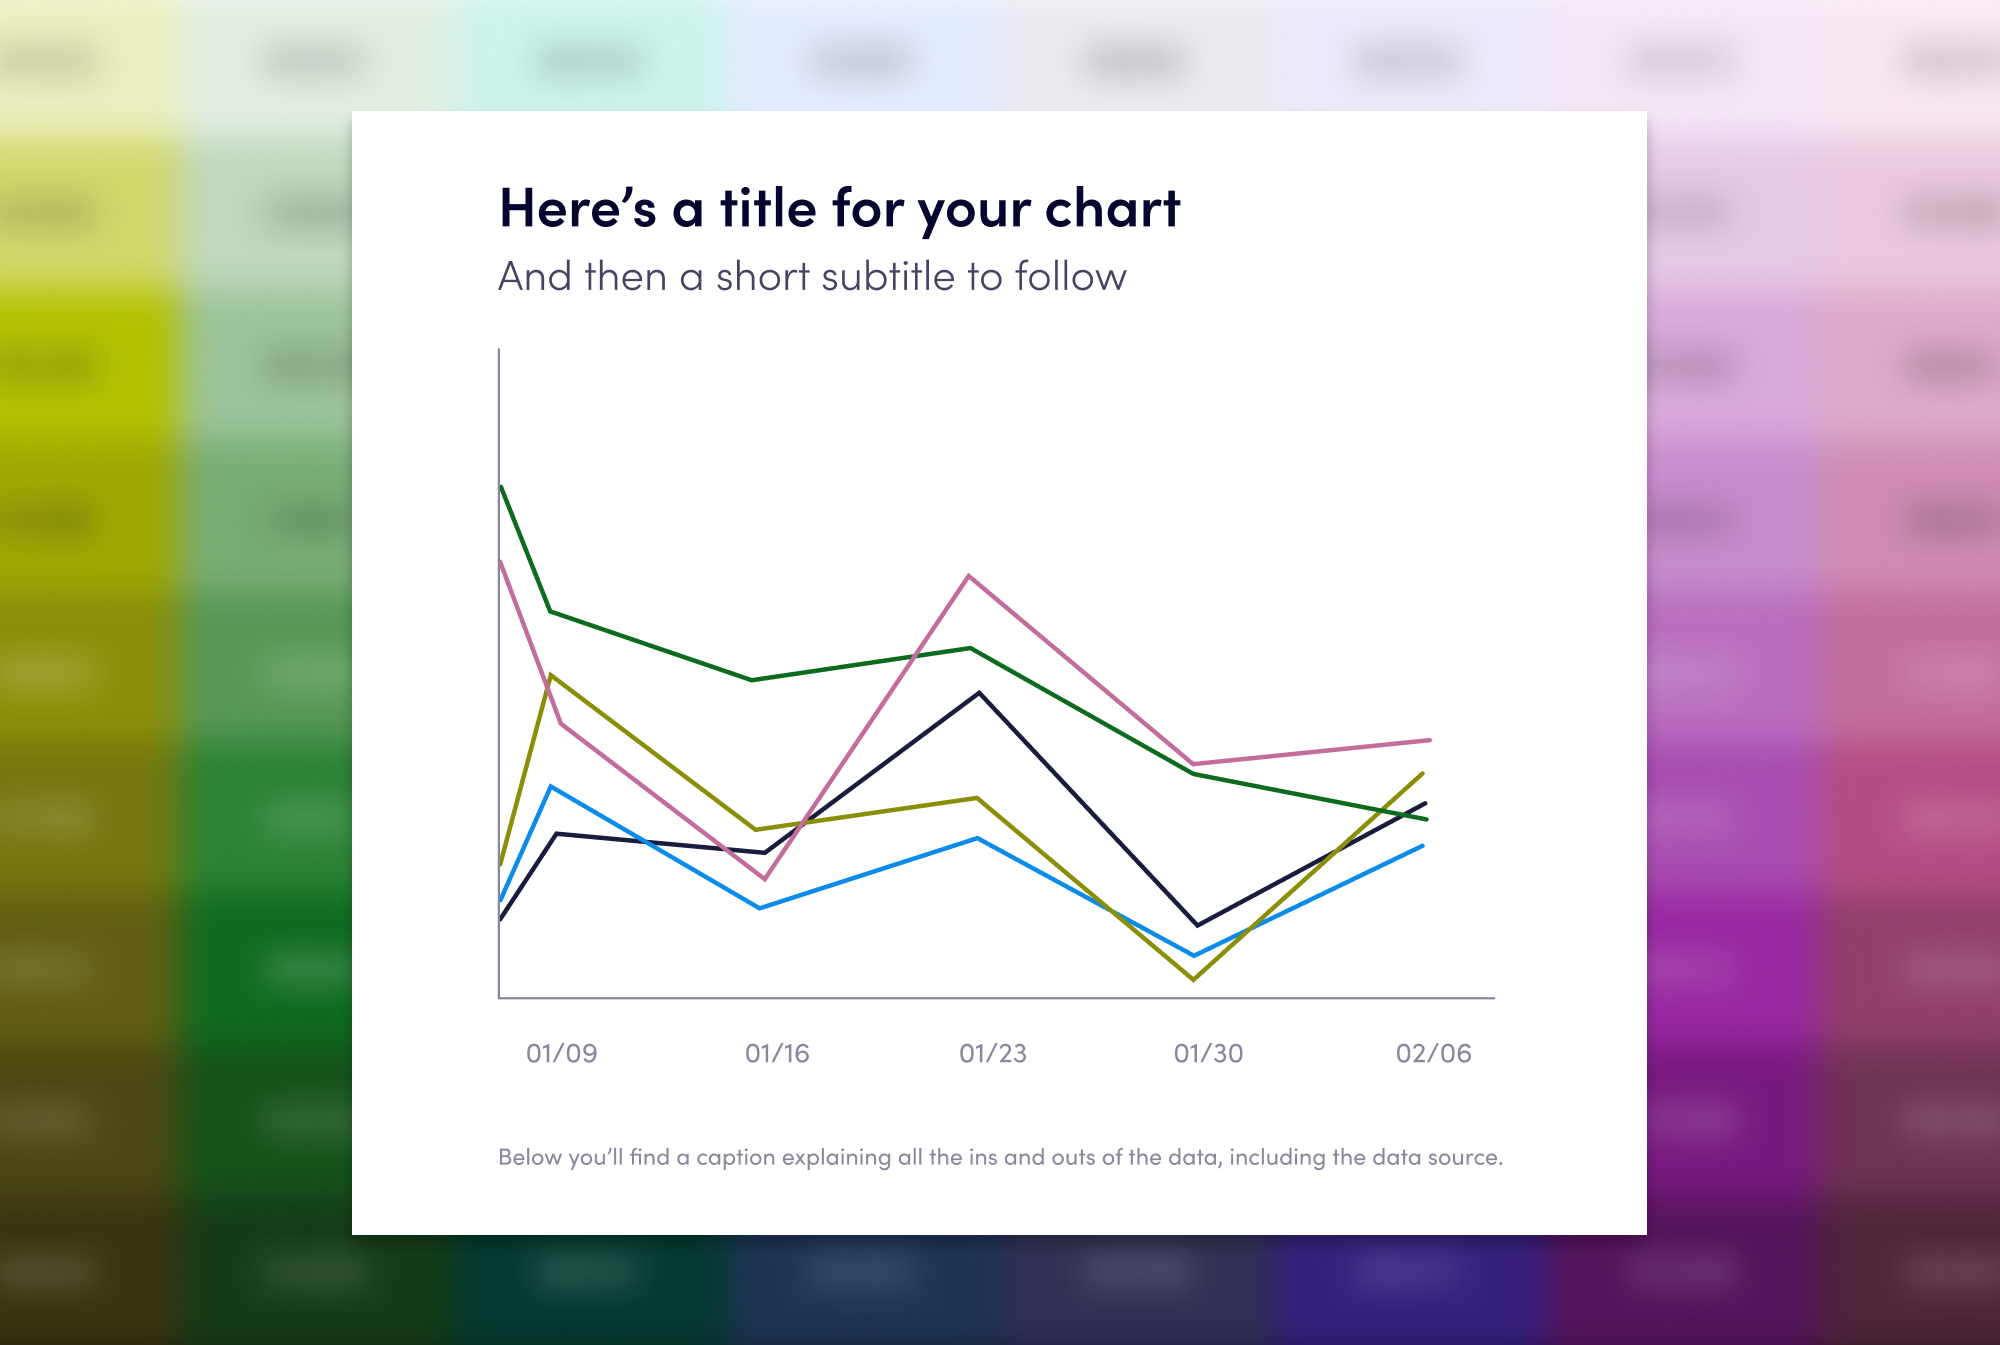
I created a custom, accessible color system to support data products and reports for a biotech’s start-up business unit. The system included 80 distinct colors and support for light and dark mode interfaces.
Ask me about my process & approach.
Northeastern University
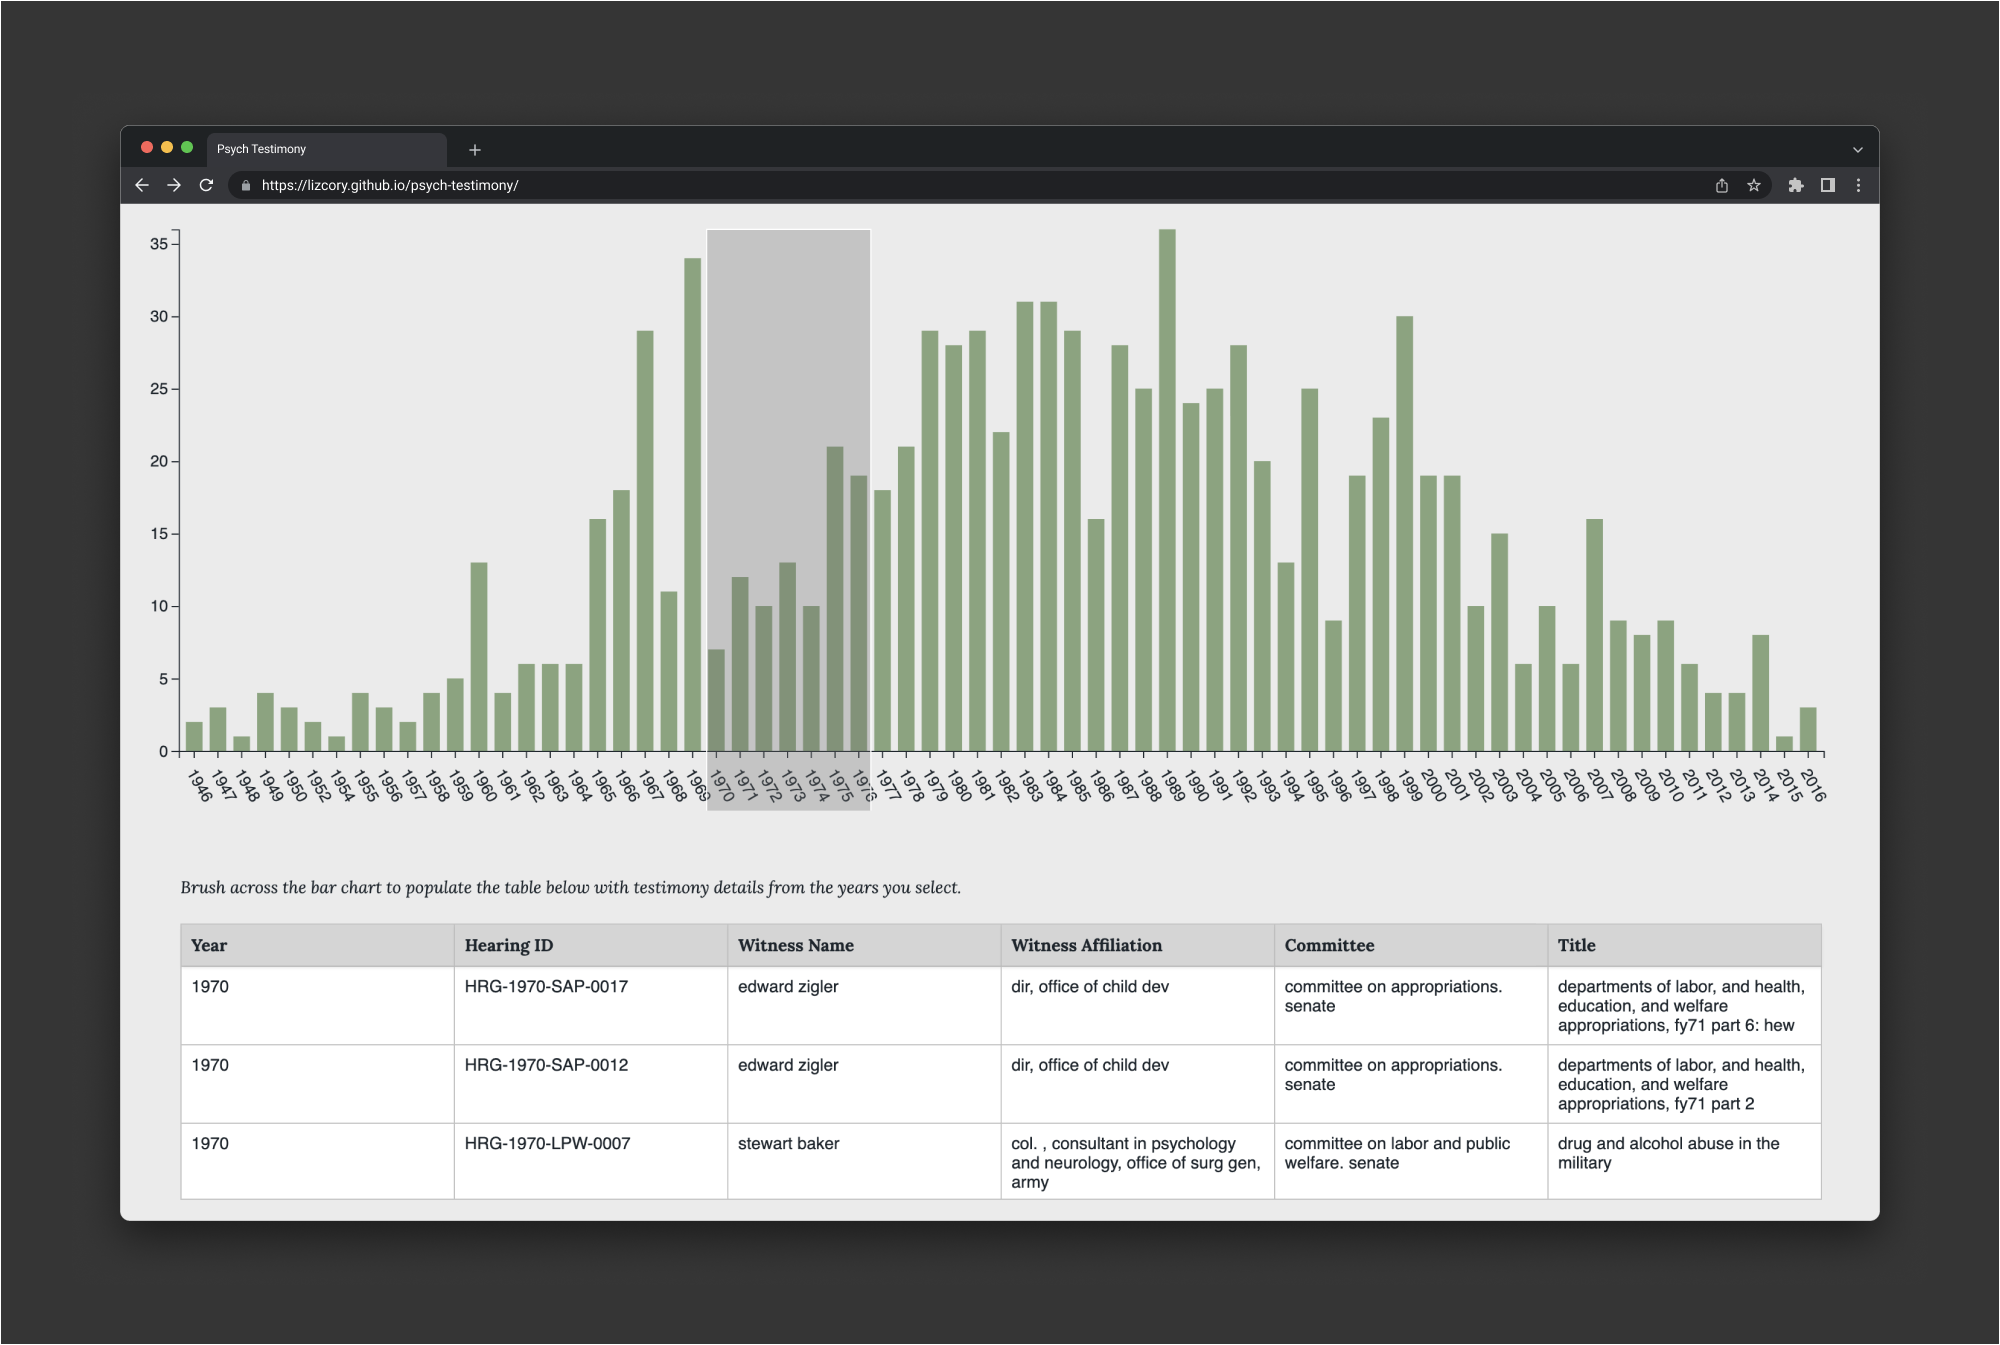
Psychologist Testimony
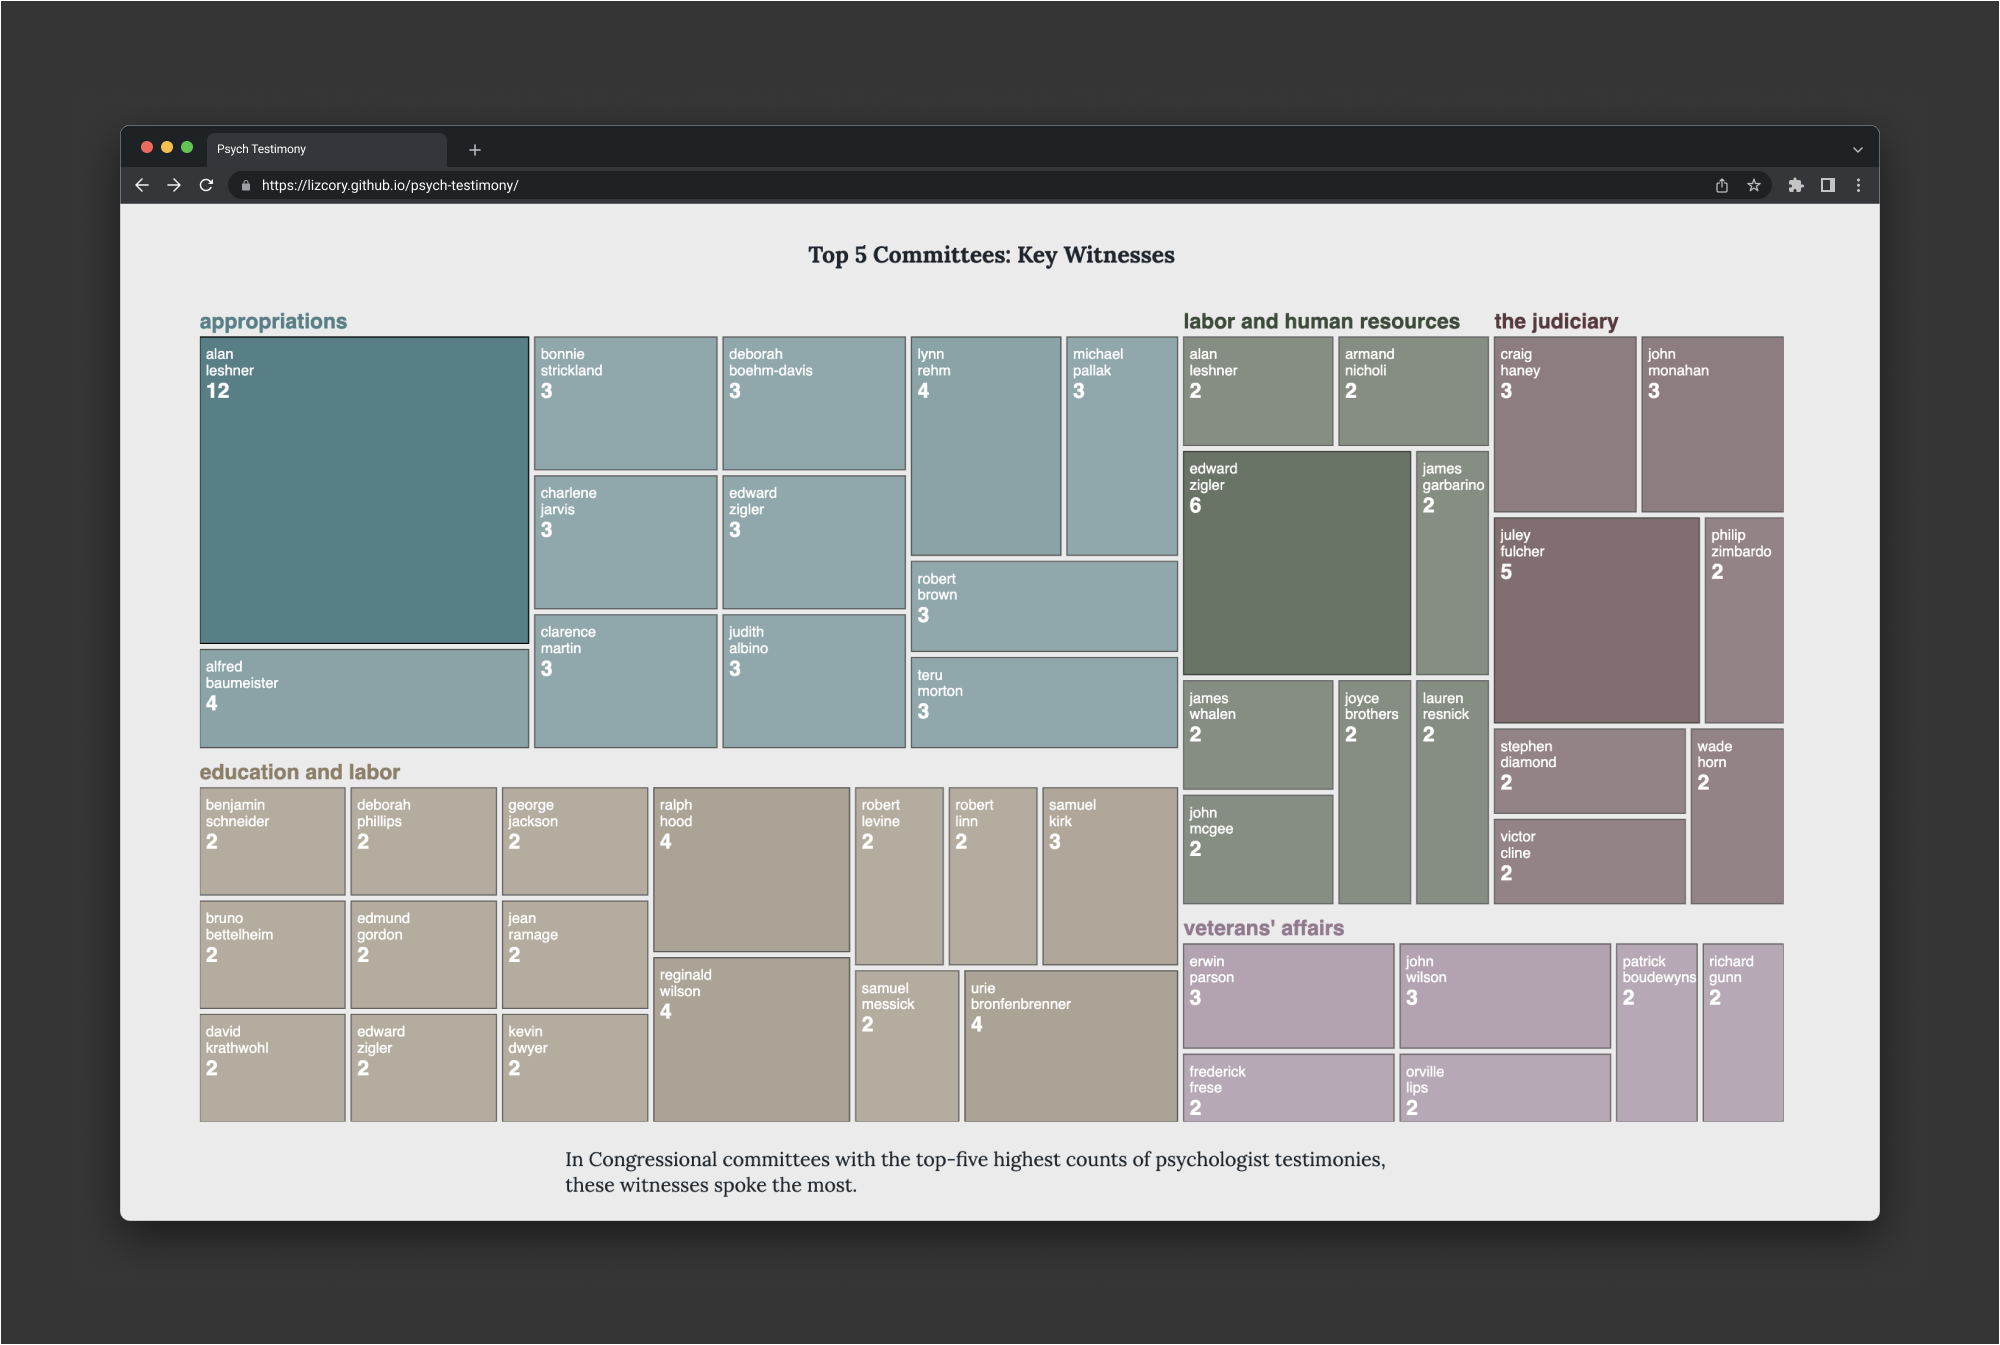
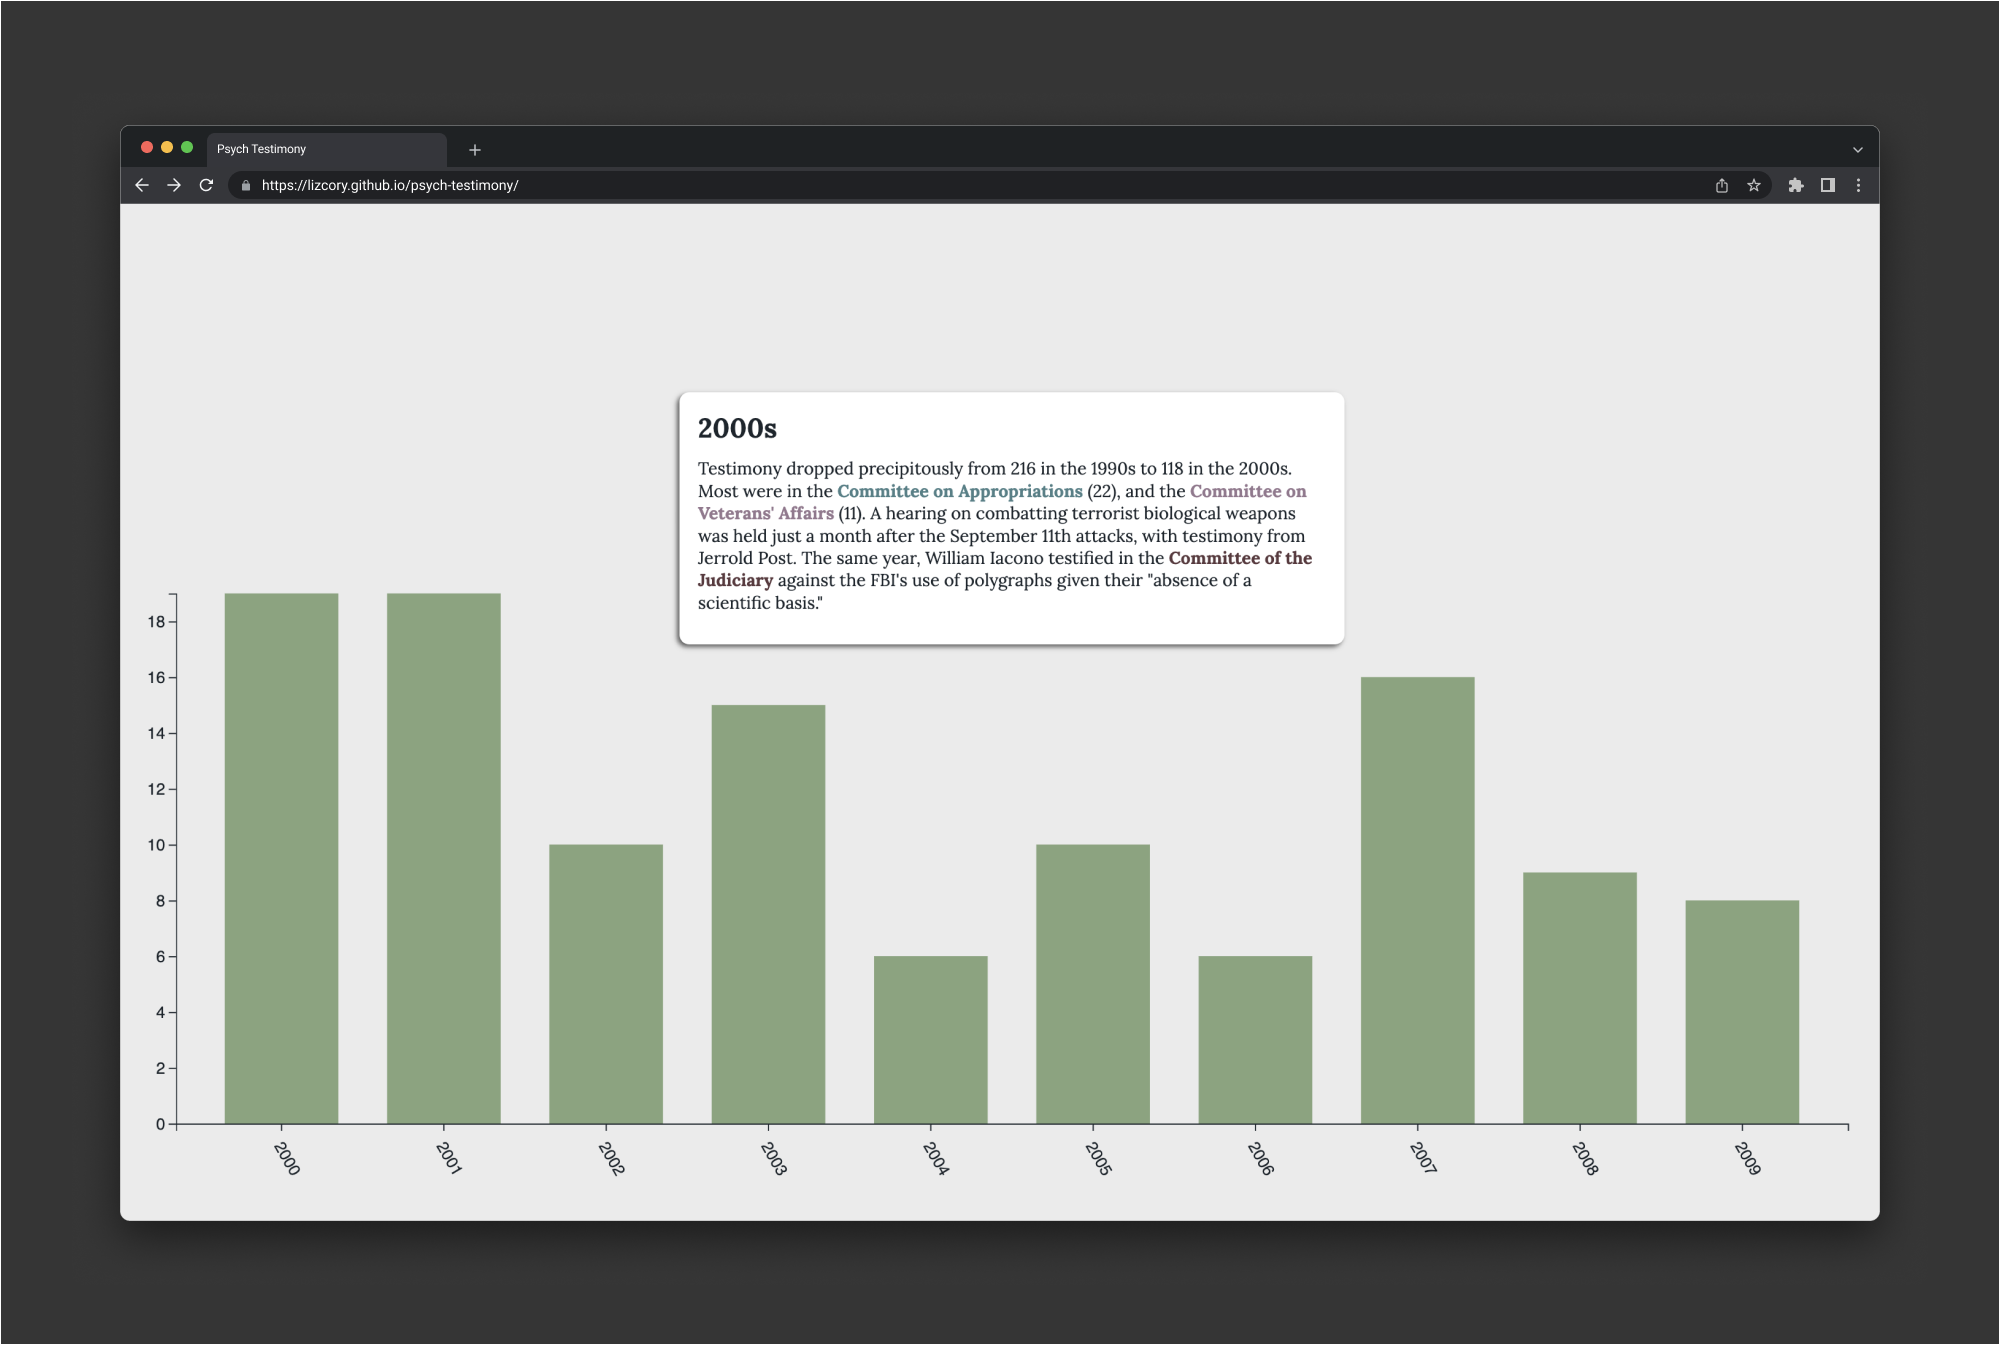
A brief history of the rise and fall in US Congressional testimony given by psychologists over the past ~50 years. Explainer text on scroll gives highlights from each decade. At the end, explore the full set of testimonies and key witnesses by committee. Data source: Social Scientists Before Congress (Seguin et al., 2020).
Northeastern University
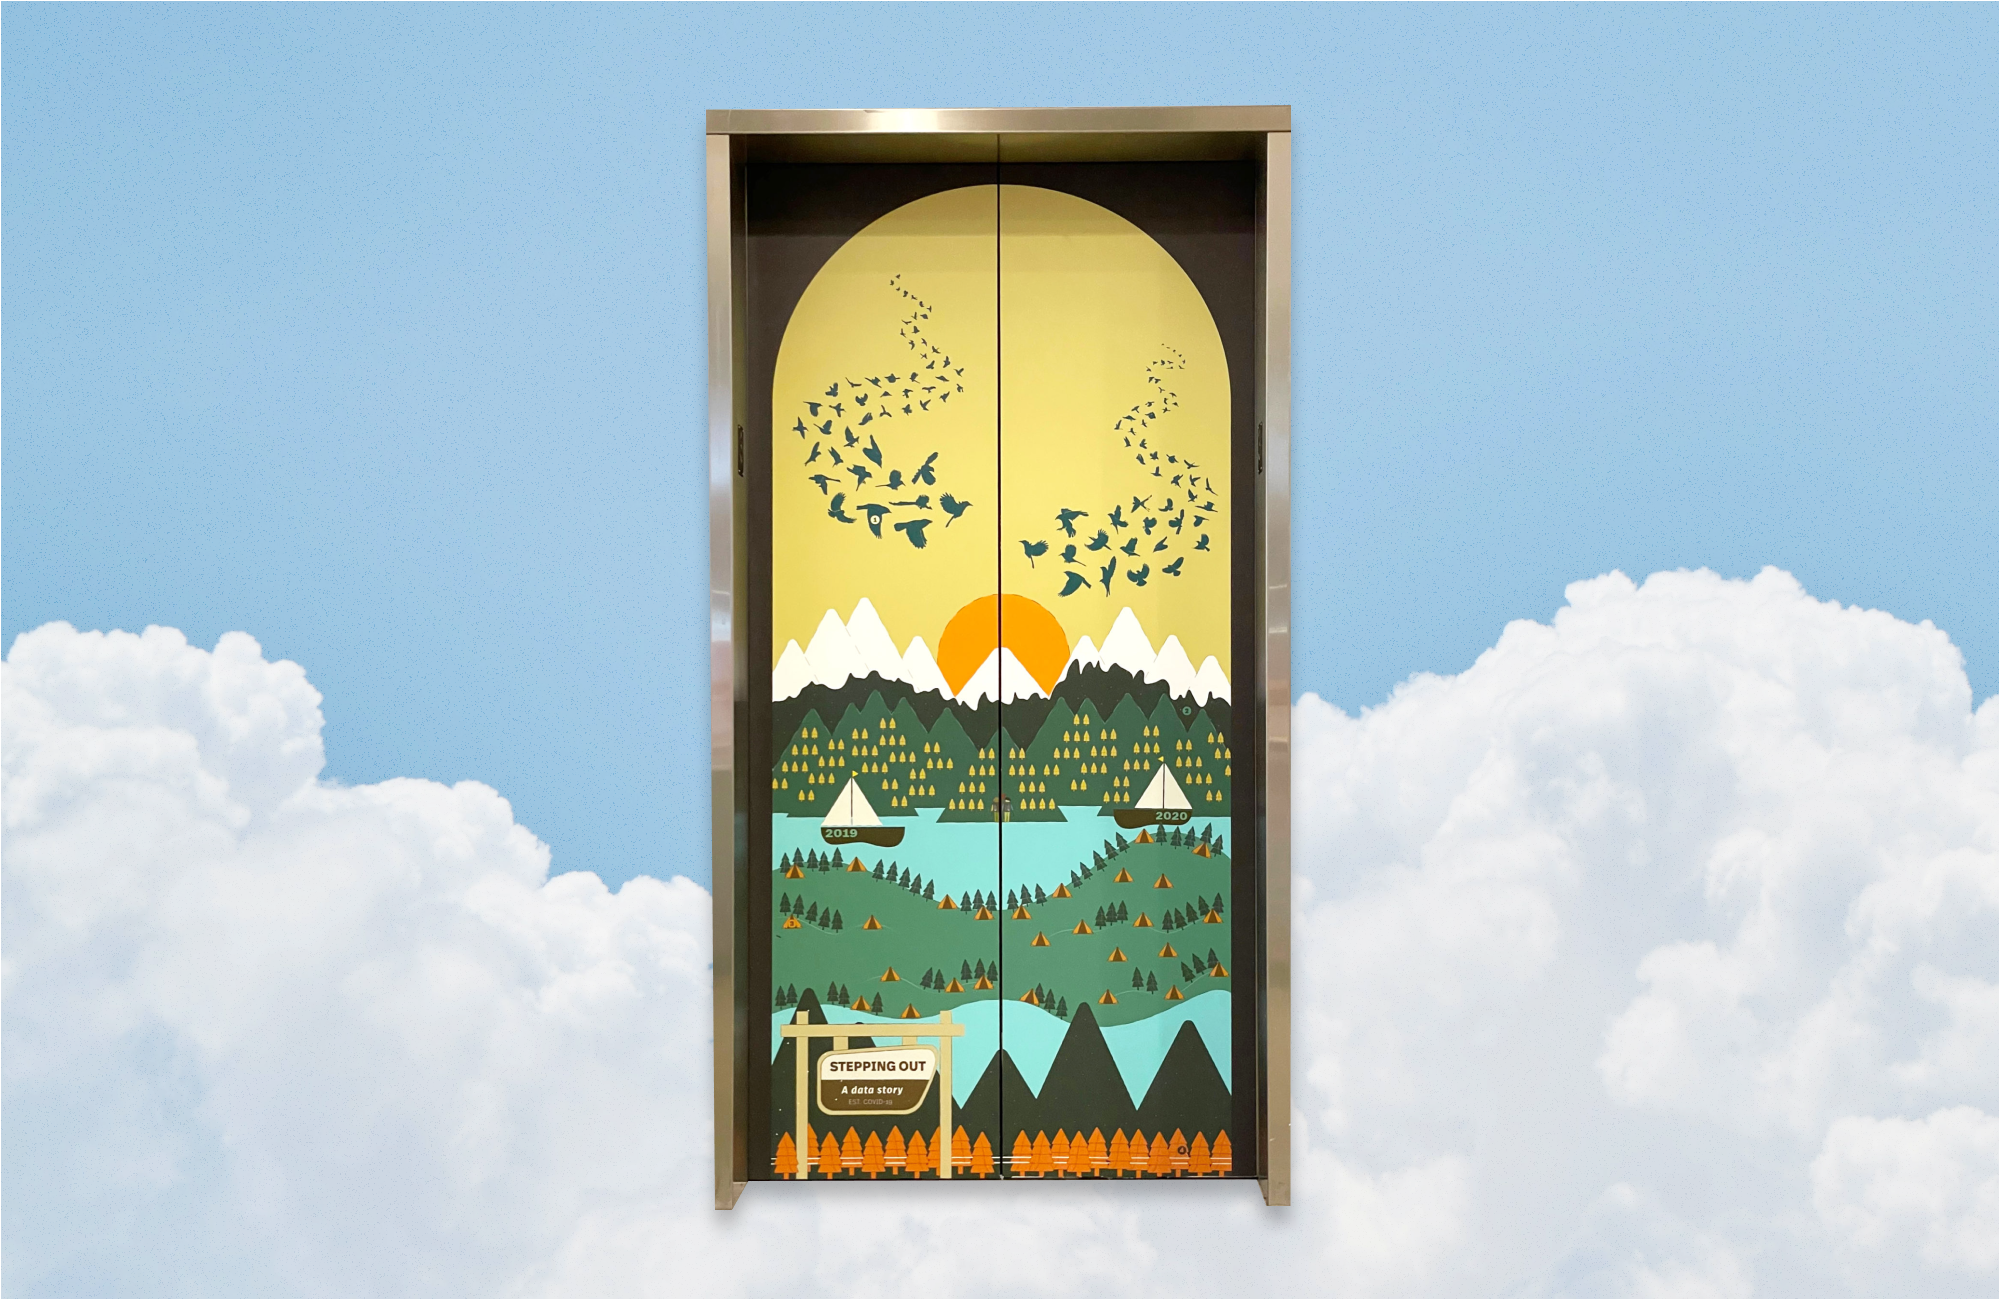
Stepping Out
As part of Northeastern University’s “Protect The Pack” COVID-19 marketing campaign, my collaborators and I designed a data-based art installation for a library elevator door. We analyzed several datasets showing an uptick in outdoor activity during the pandemic lockdowns of 2020. Selected for the 2022 Information is Beautiful Awards Longlist.
Interdisciplinary Affective Science Lab
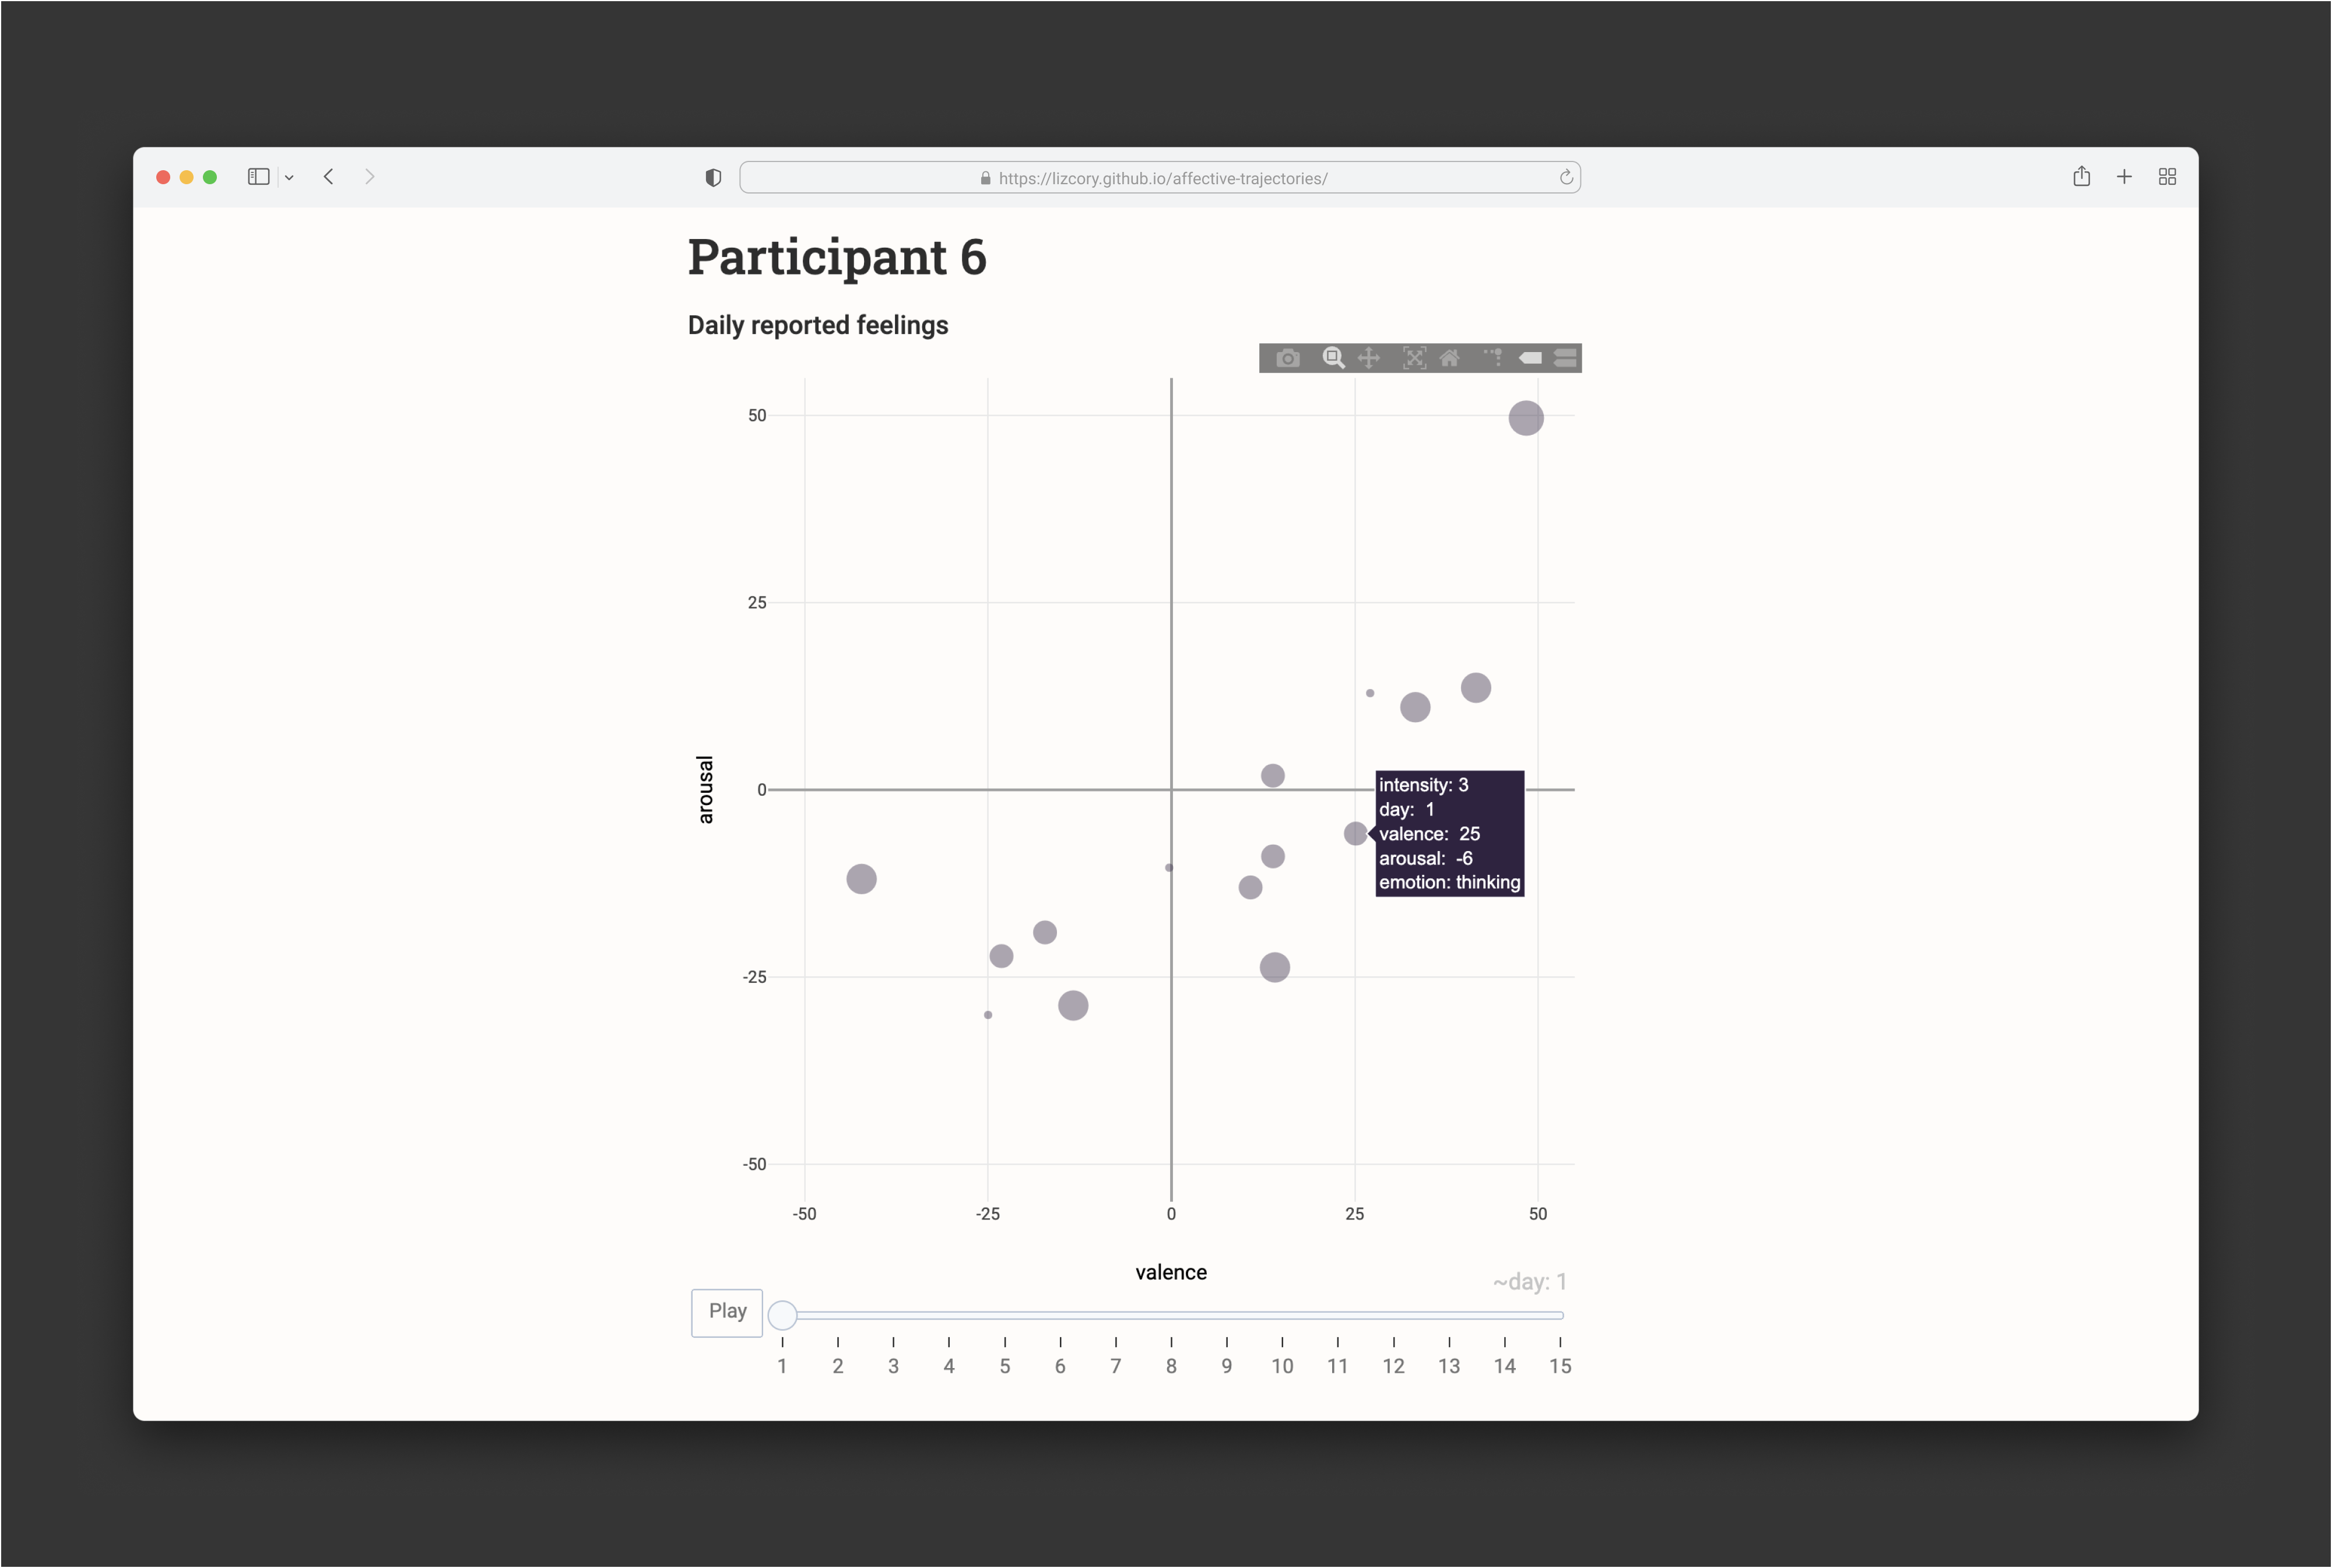
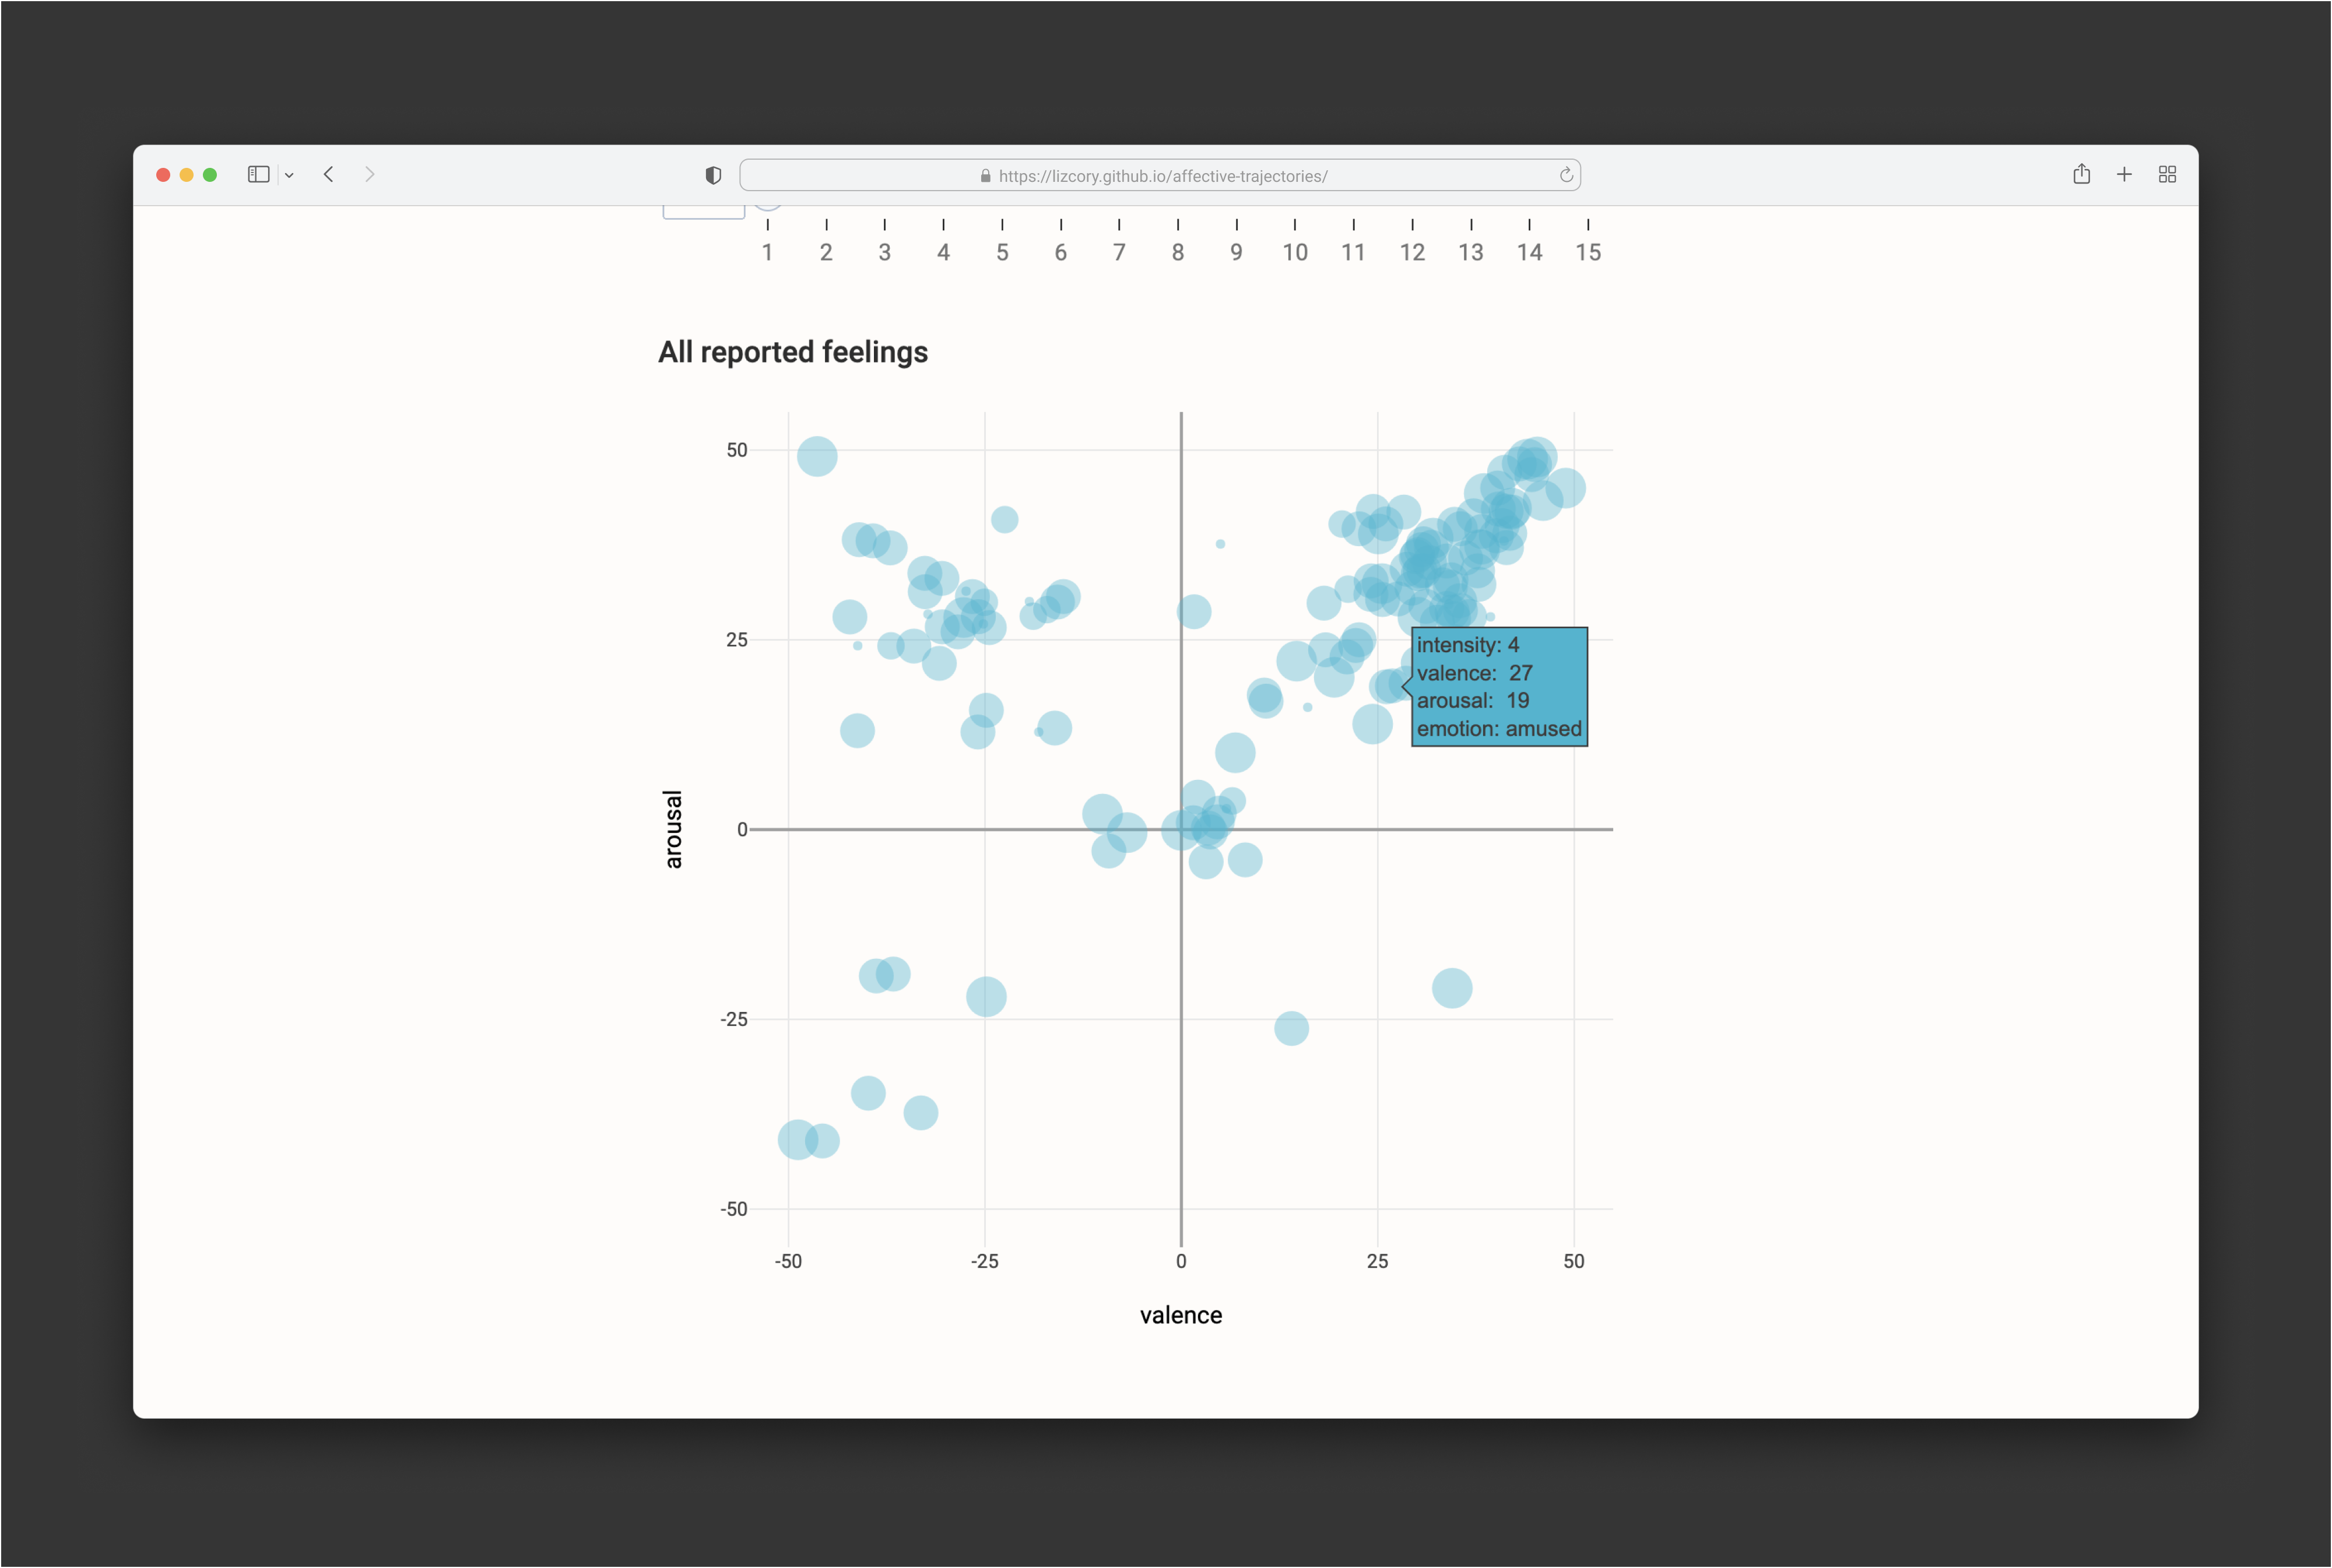
Affective Trajectories
How do our feelings shift over time? This project illustrates the emotional journeys of six people over a two-week period. The design includes animation and small multiples to show how feelings can shift rapidly and intensely for some and stay stagnant for others. Data source: IASLab.
~ Just for Fun ~
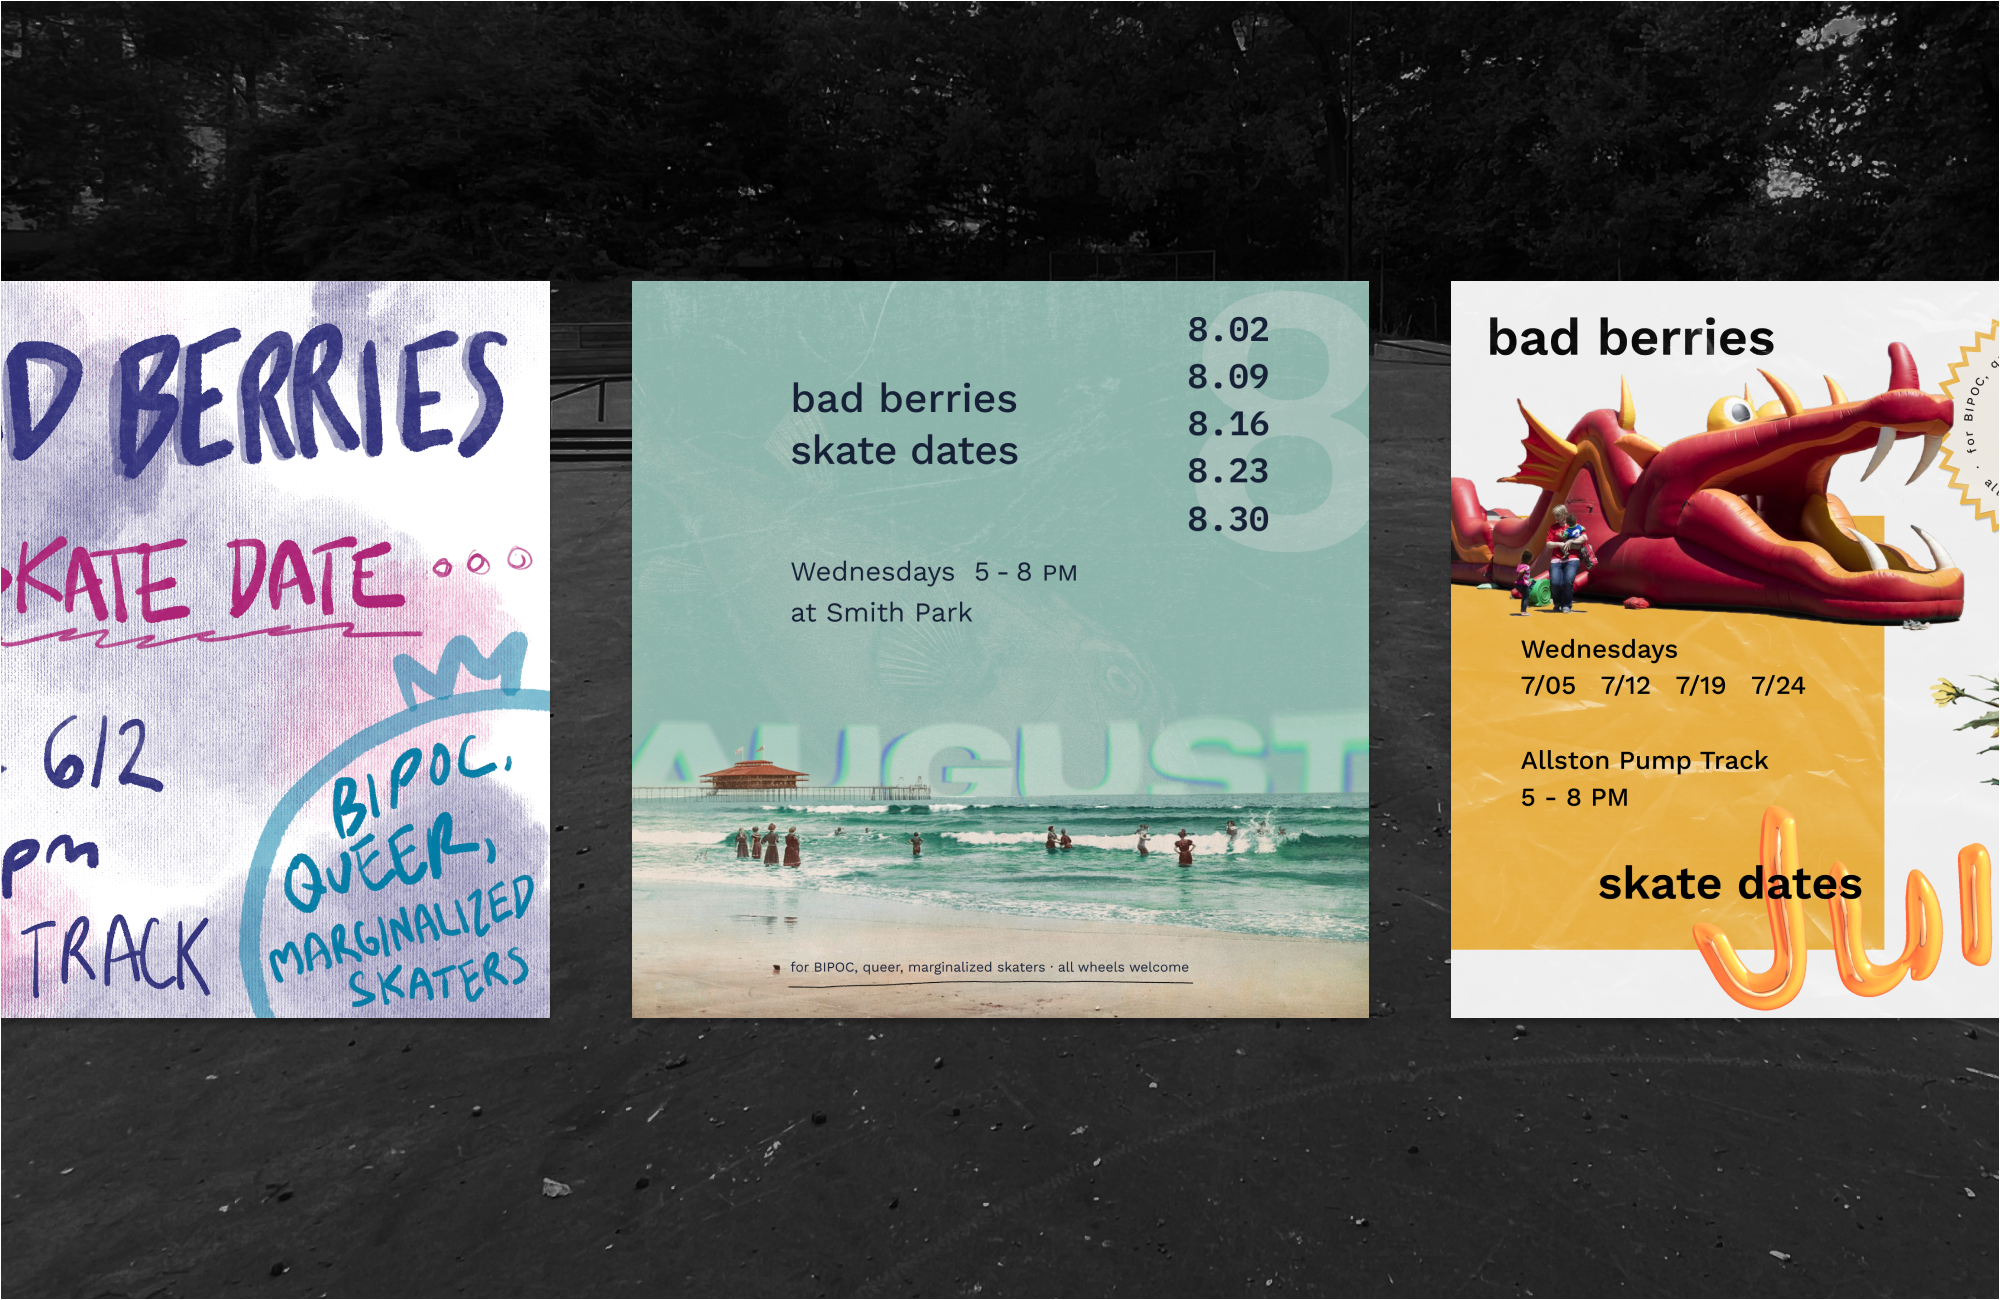
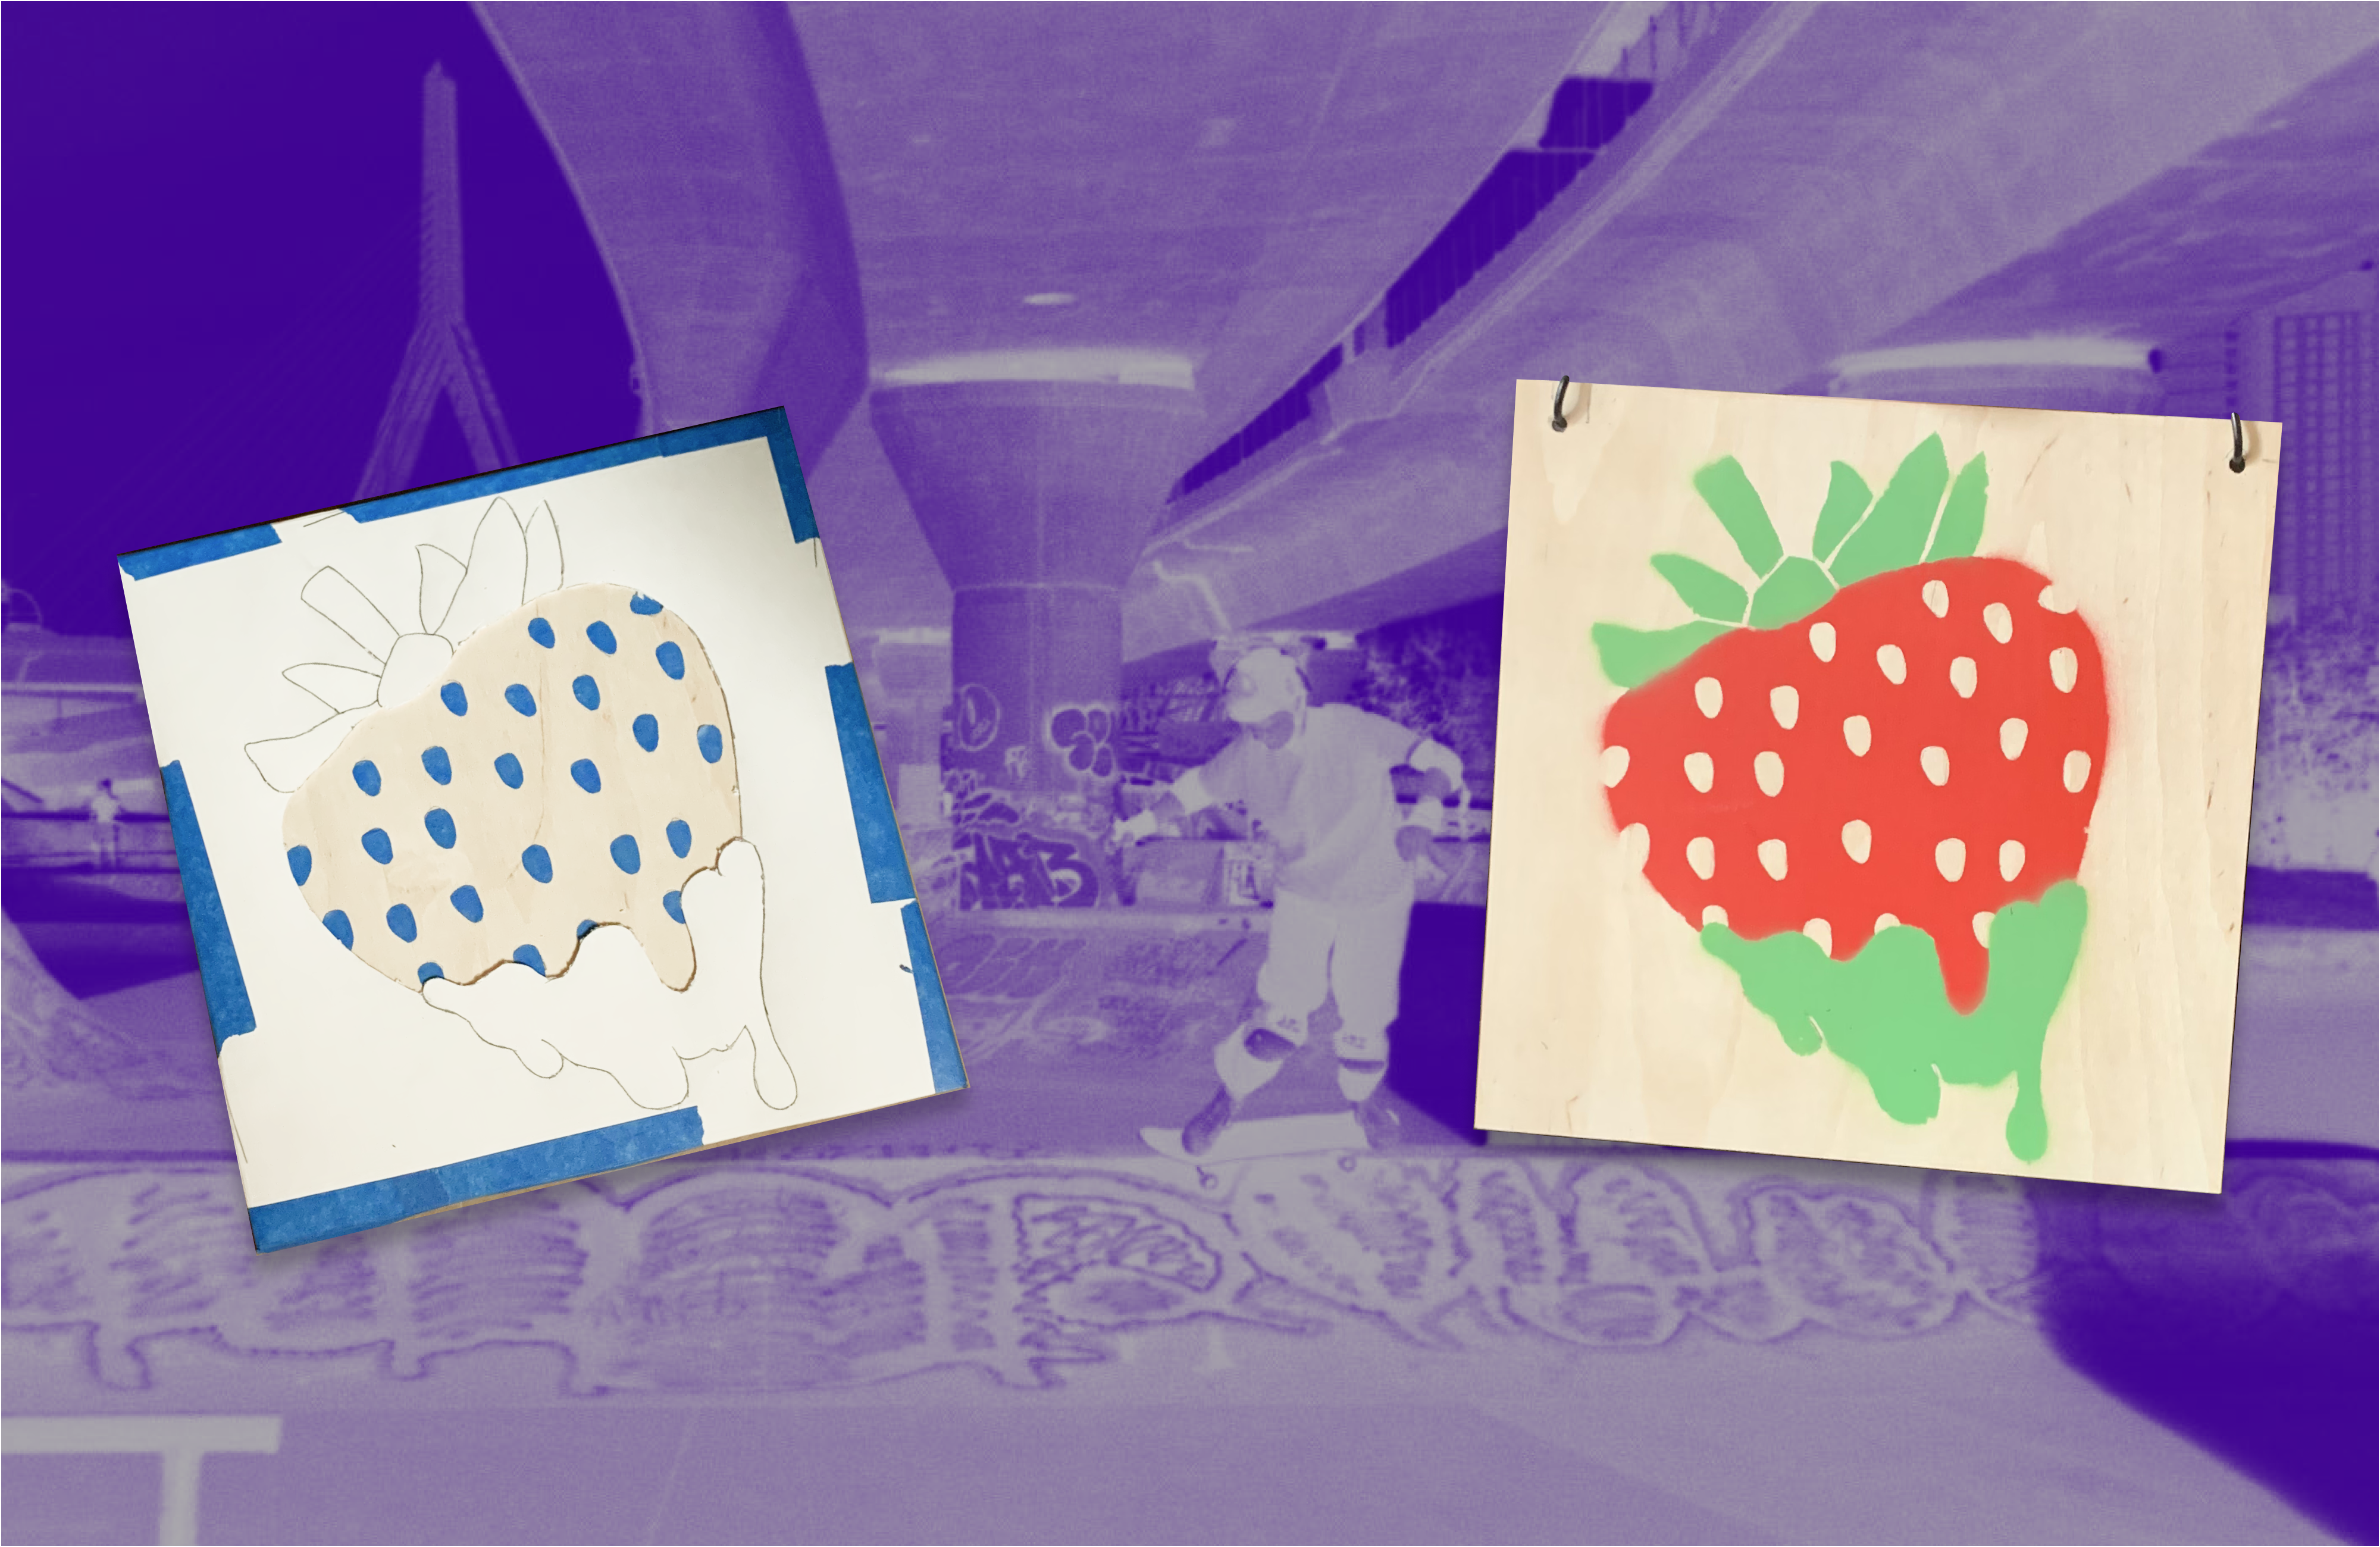
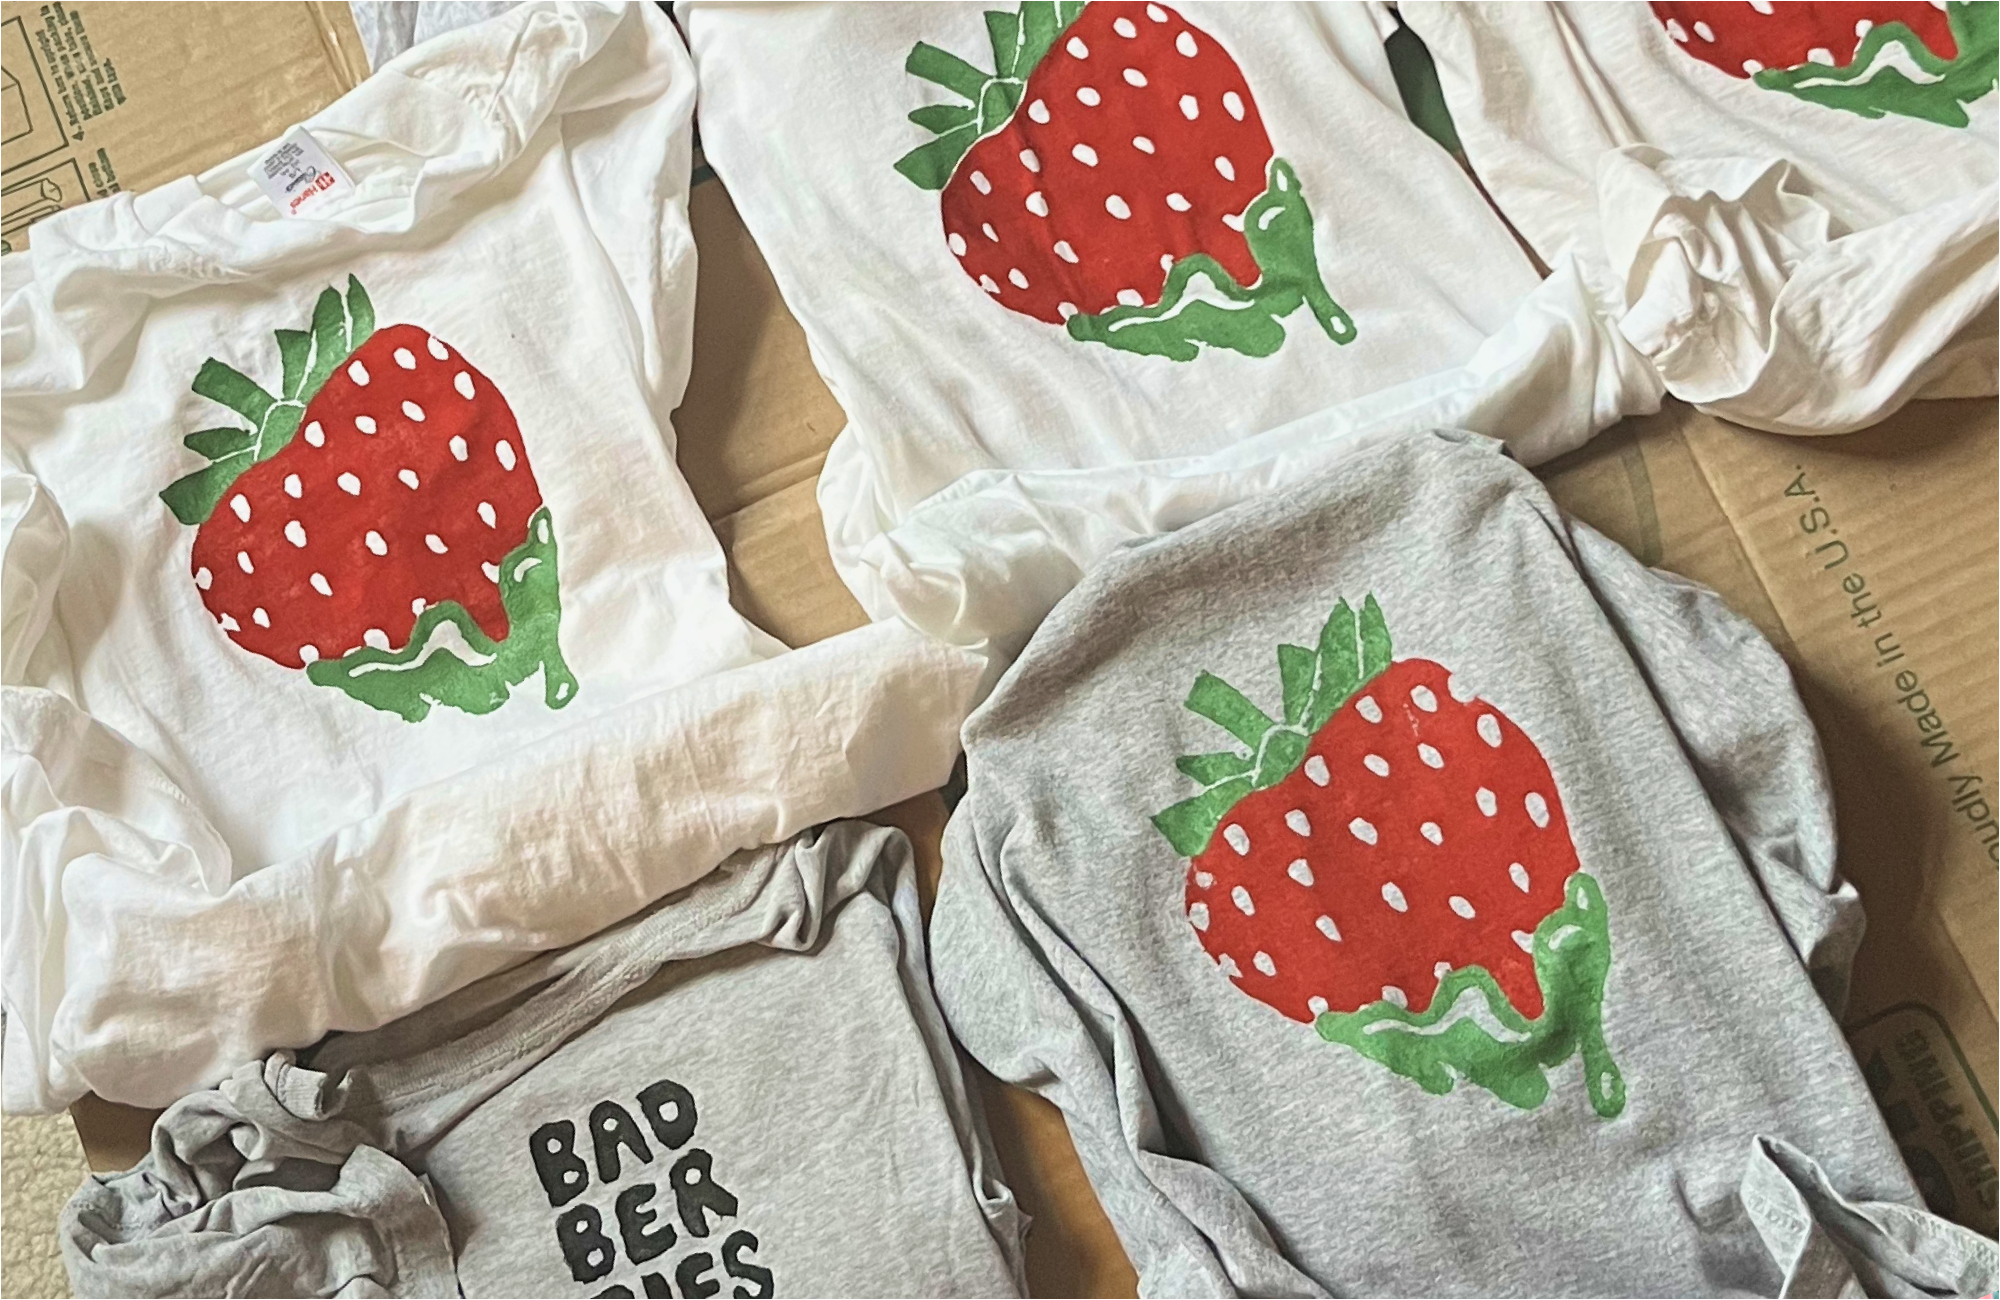
Bad Berries Skate Co.
In 2022, I co-founded a skateboarding meet-up group called Bad Berries. I had a lot of fun making flyers and learning new printing techniques.